-
On this page:
- Open Geospatial Data Portal
- NABIS online mapping tool
- Regional commercial fisheries: overviews of activity
- Commercial fishing – all methods
- Commercial fishing – trawl
- Customary fisheries management areas
- Recreational fishing (amateur and charter fishing vessels)
- Marine protected areas
Open Geospatial Data Portal
The online portal allows public access to spatial data relating to the commercial fishing regulations.
Updated data sets include coordinates for fisheries management areas, general statistical areas, and quota management areas.
The portal also has regulation information on current:
- commercial fishing regulations (including closed seamount areas and PSH 71A approvals)
- benthic protection areas
- fishery notices (including temporary closures that are not Section 186A/B closures)
- marine reserves Type 1 and 2
- marine mammal sanctuary (one area closed for set netting)
- ministerial decisions
- submarine cables and pipeline protection zones.
Go to the online fishing data portal
The portal also has links to other government data relevant to the fishing industry. They include links to Land Information New Zealand (Exclusive Economic Zone and Topo50 Coastline) and the Department of Conservation (Marine Mammal Sanctuaries).
Data sets can be downloaded in several formats, such as Shapefile, KML, CSV and others. All data sets include full metadata. A step-by-step user guide is available to help you download the files.
NABIS mapping tool – create and view fishery maps
You can use our interactive mapping tool, NABIS, to make maps and get statistics for:
- fishing areas for different stocks
- commercial fishing events
- fishing methods
- some non-commercial fishing
- restricted areas.
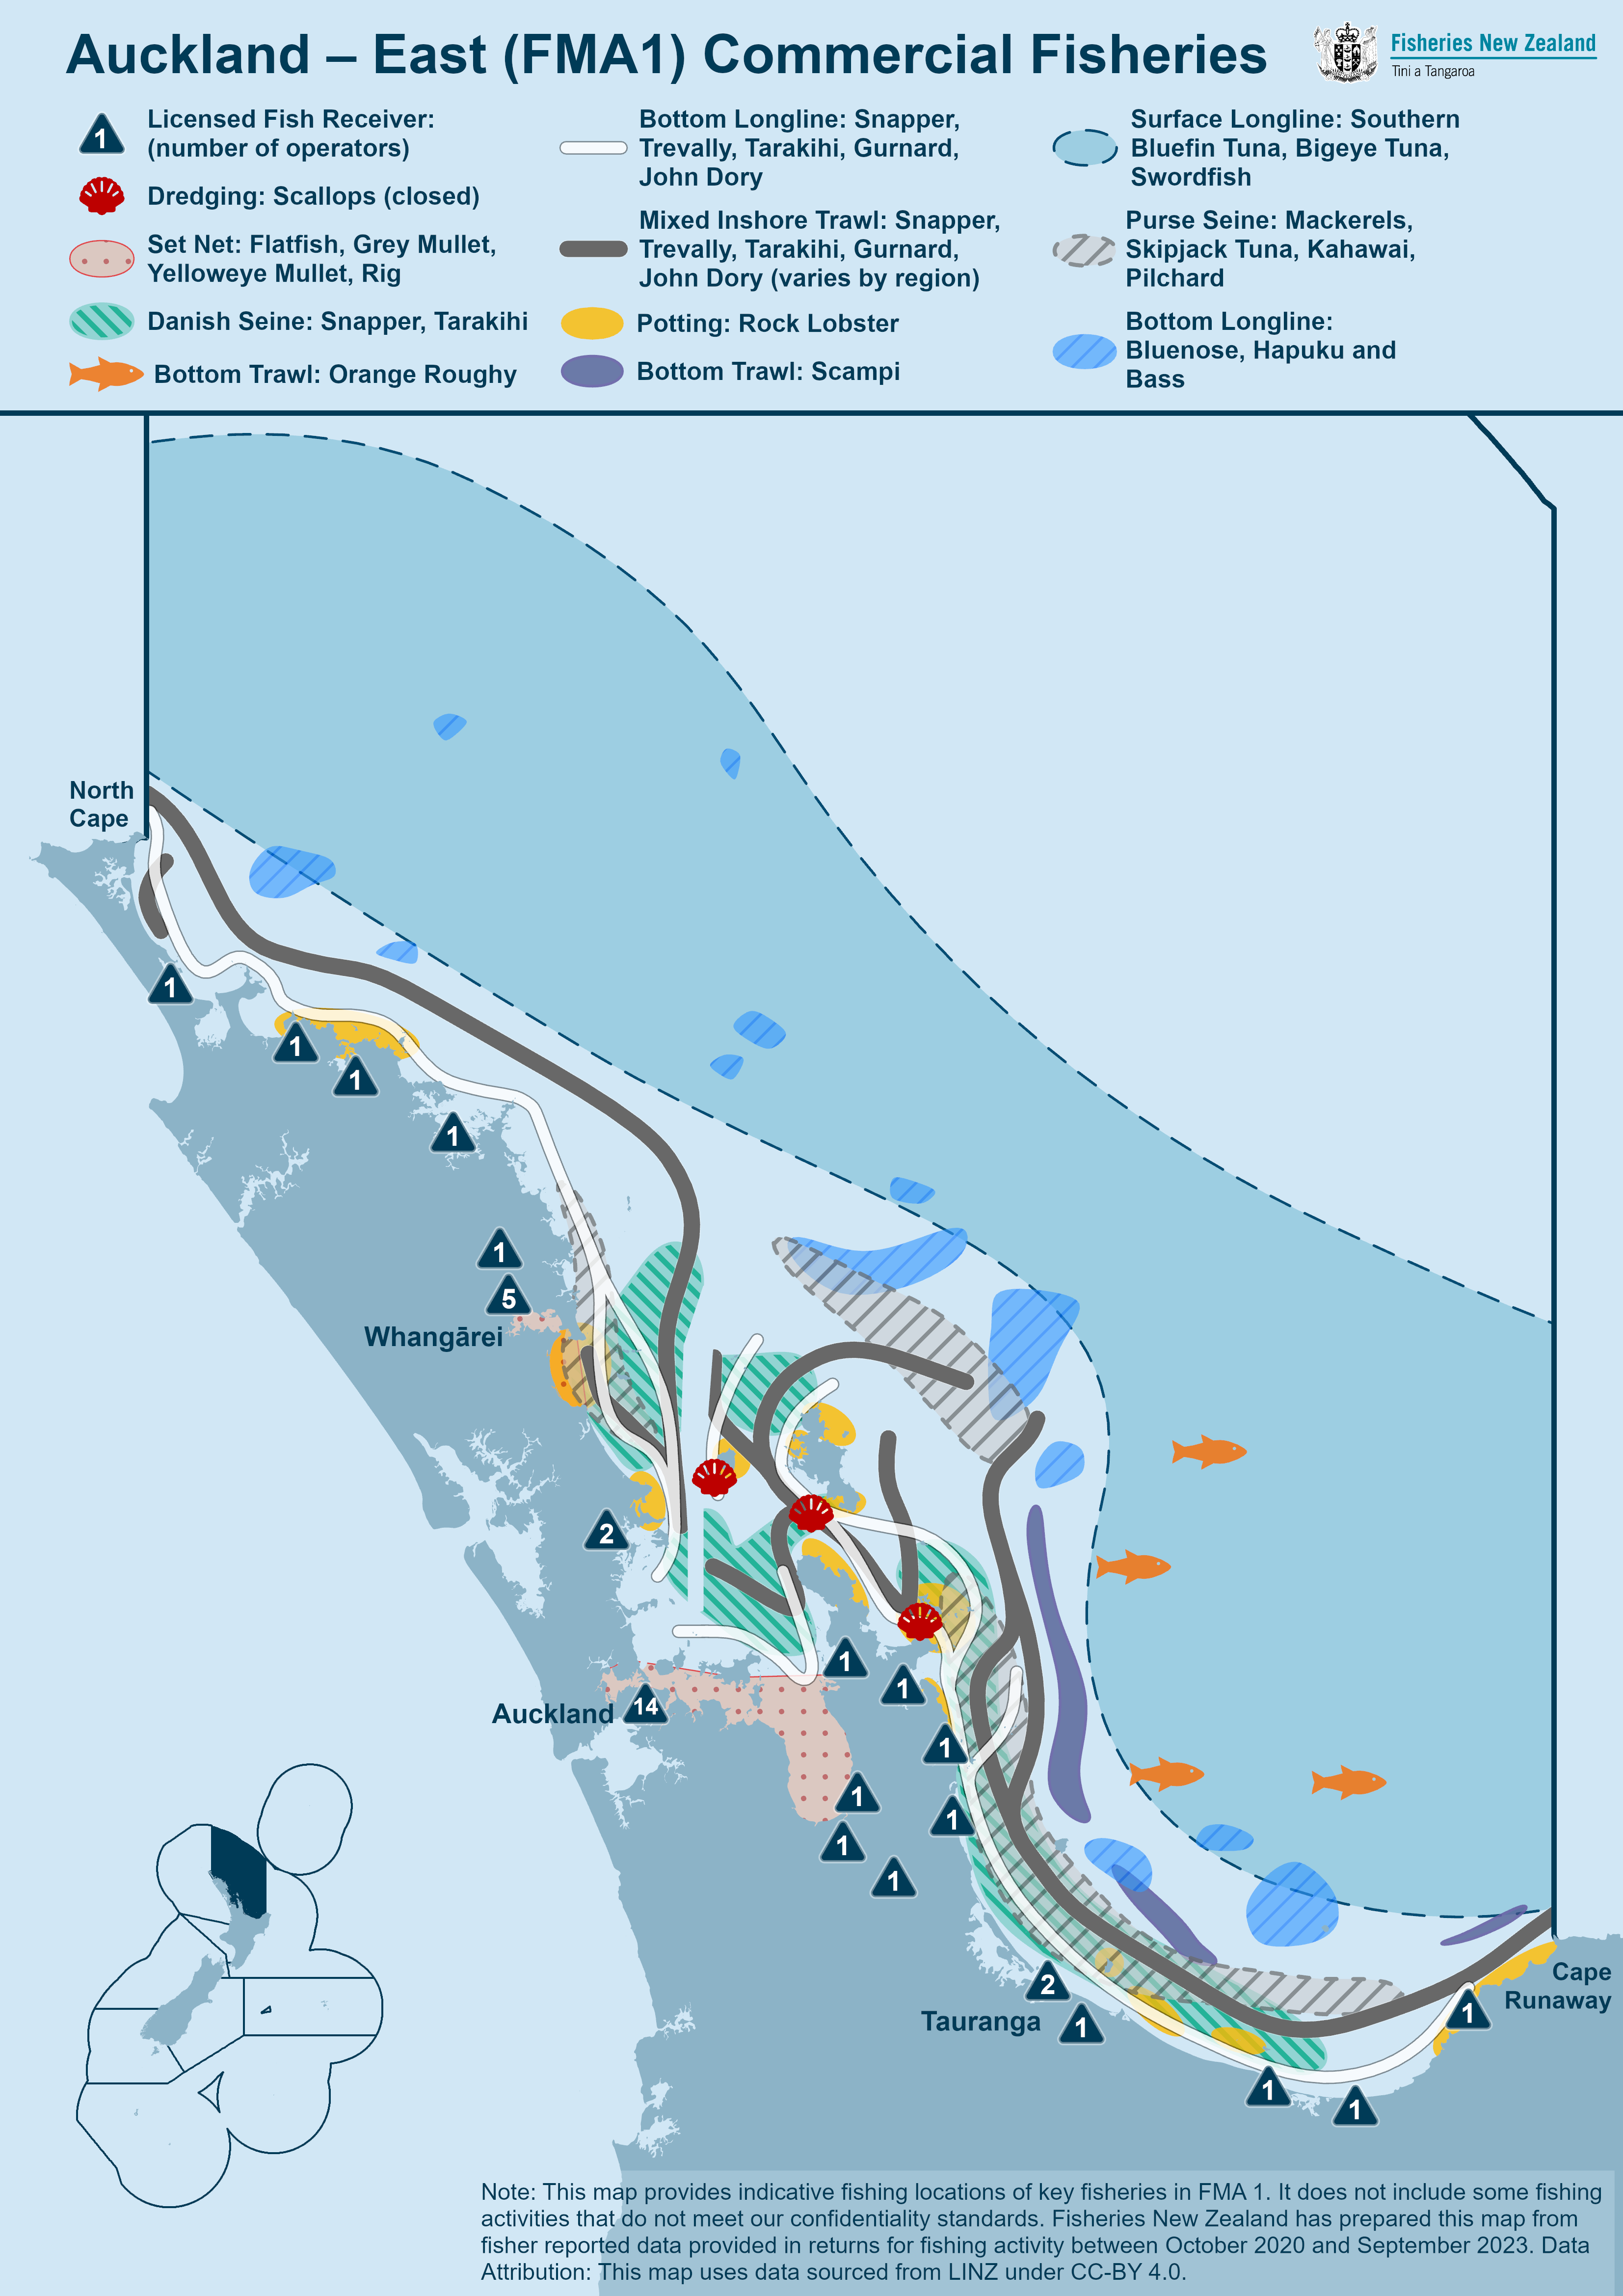
Regional commercial fisheries: Overviews of activity
These maps show an overview of commercial fishing activity in each Fisheries Management Area (FMA). They are intended to provide a simplified view of New Zealand's key commercial fisheries. They were constructed from accurate fishing location data and guided by expert fishing analysts. Due to confidentiality requirements, not all fishing activity is shown. Select or click on a map thumbnail to see it fullscreen.
 [PNG, 1.1 MB]
 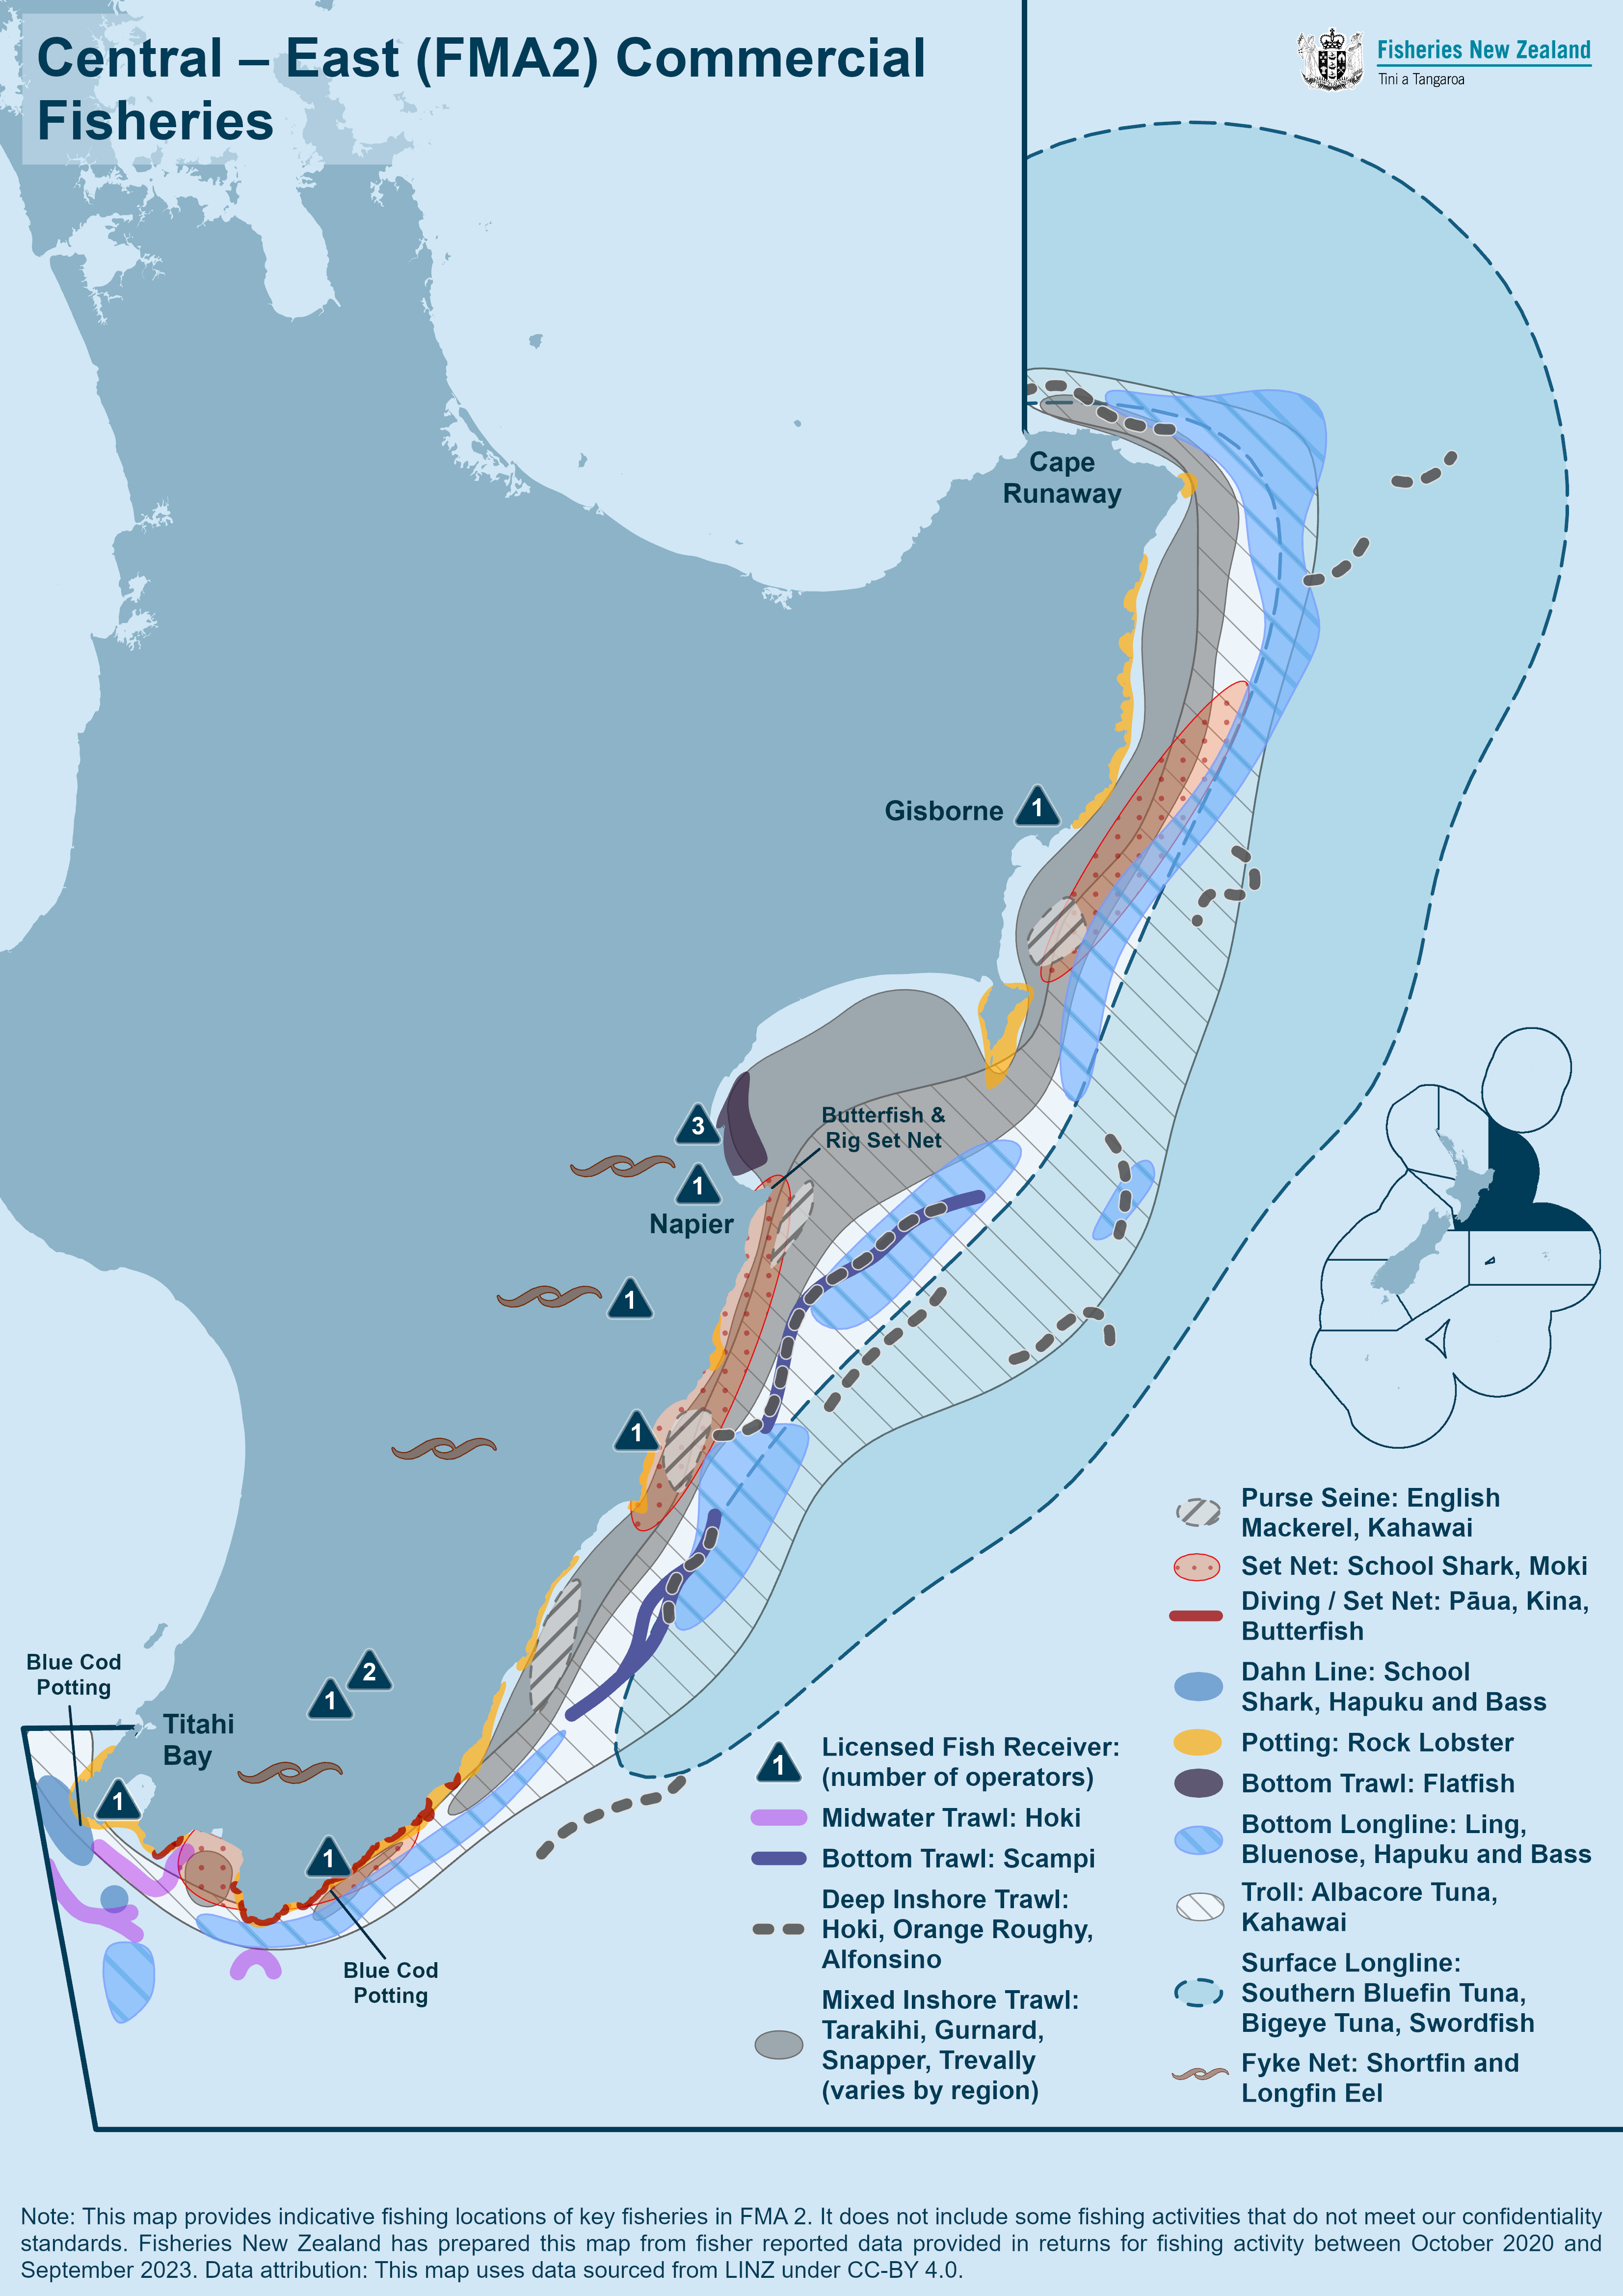 [PNG, 1.2 MB]
 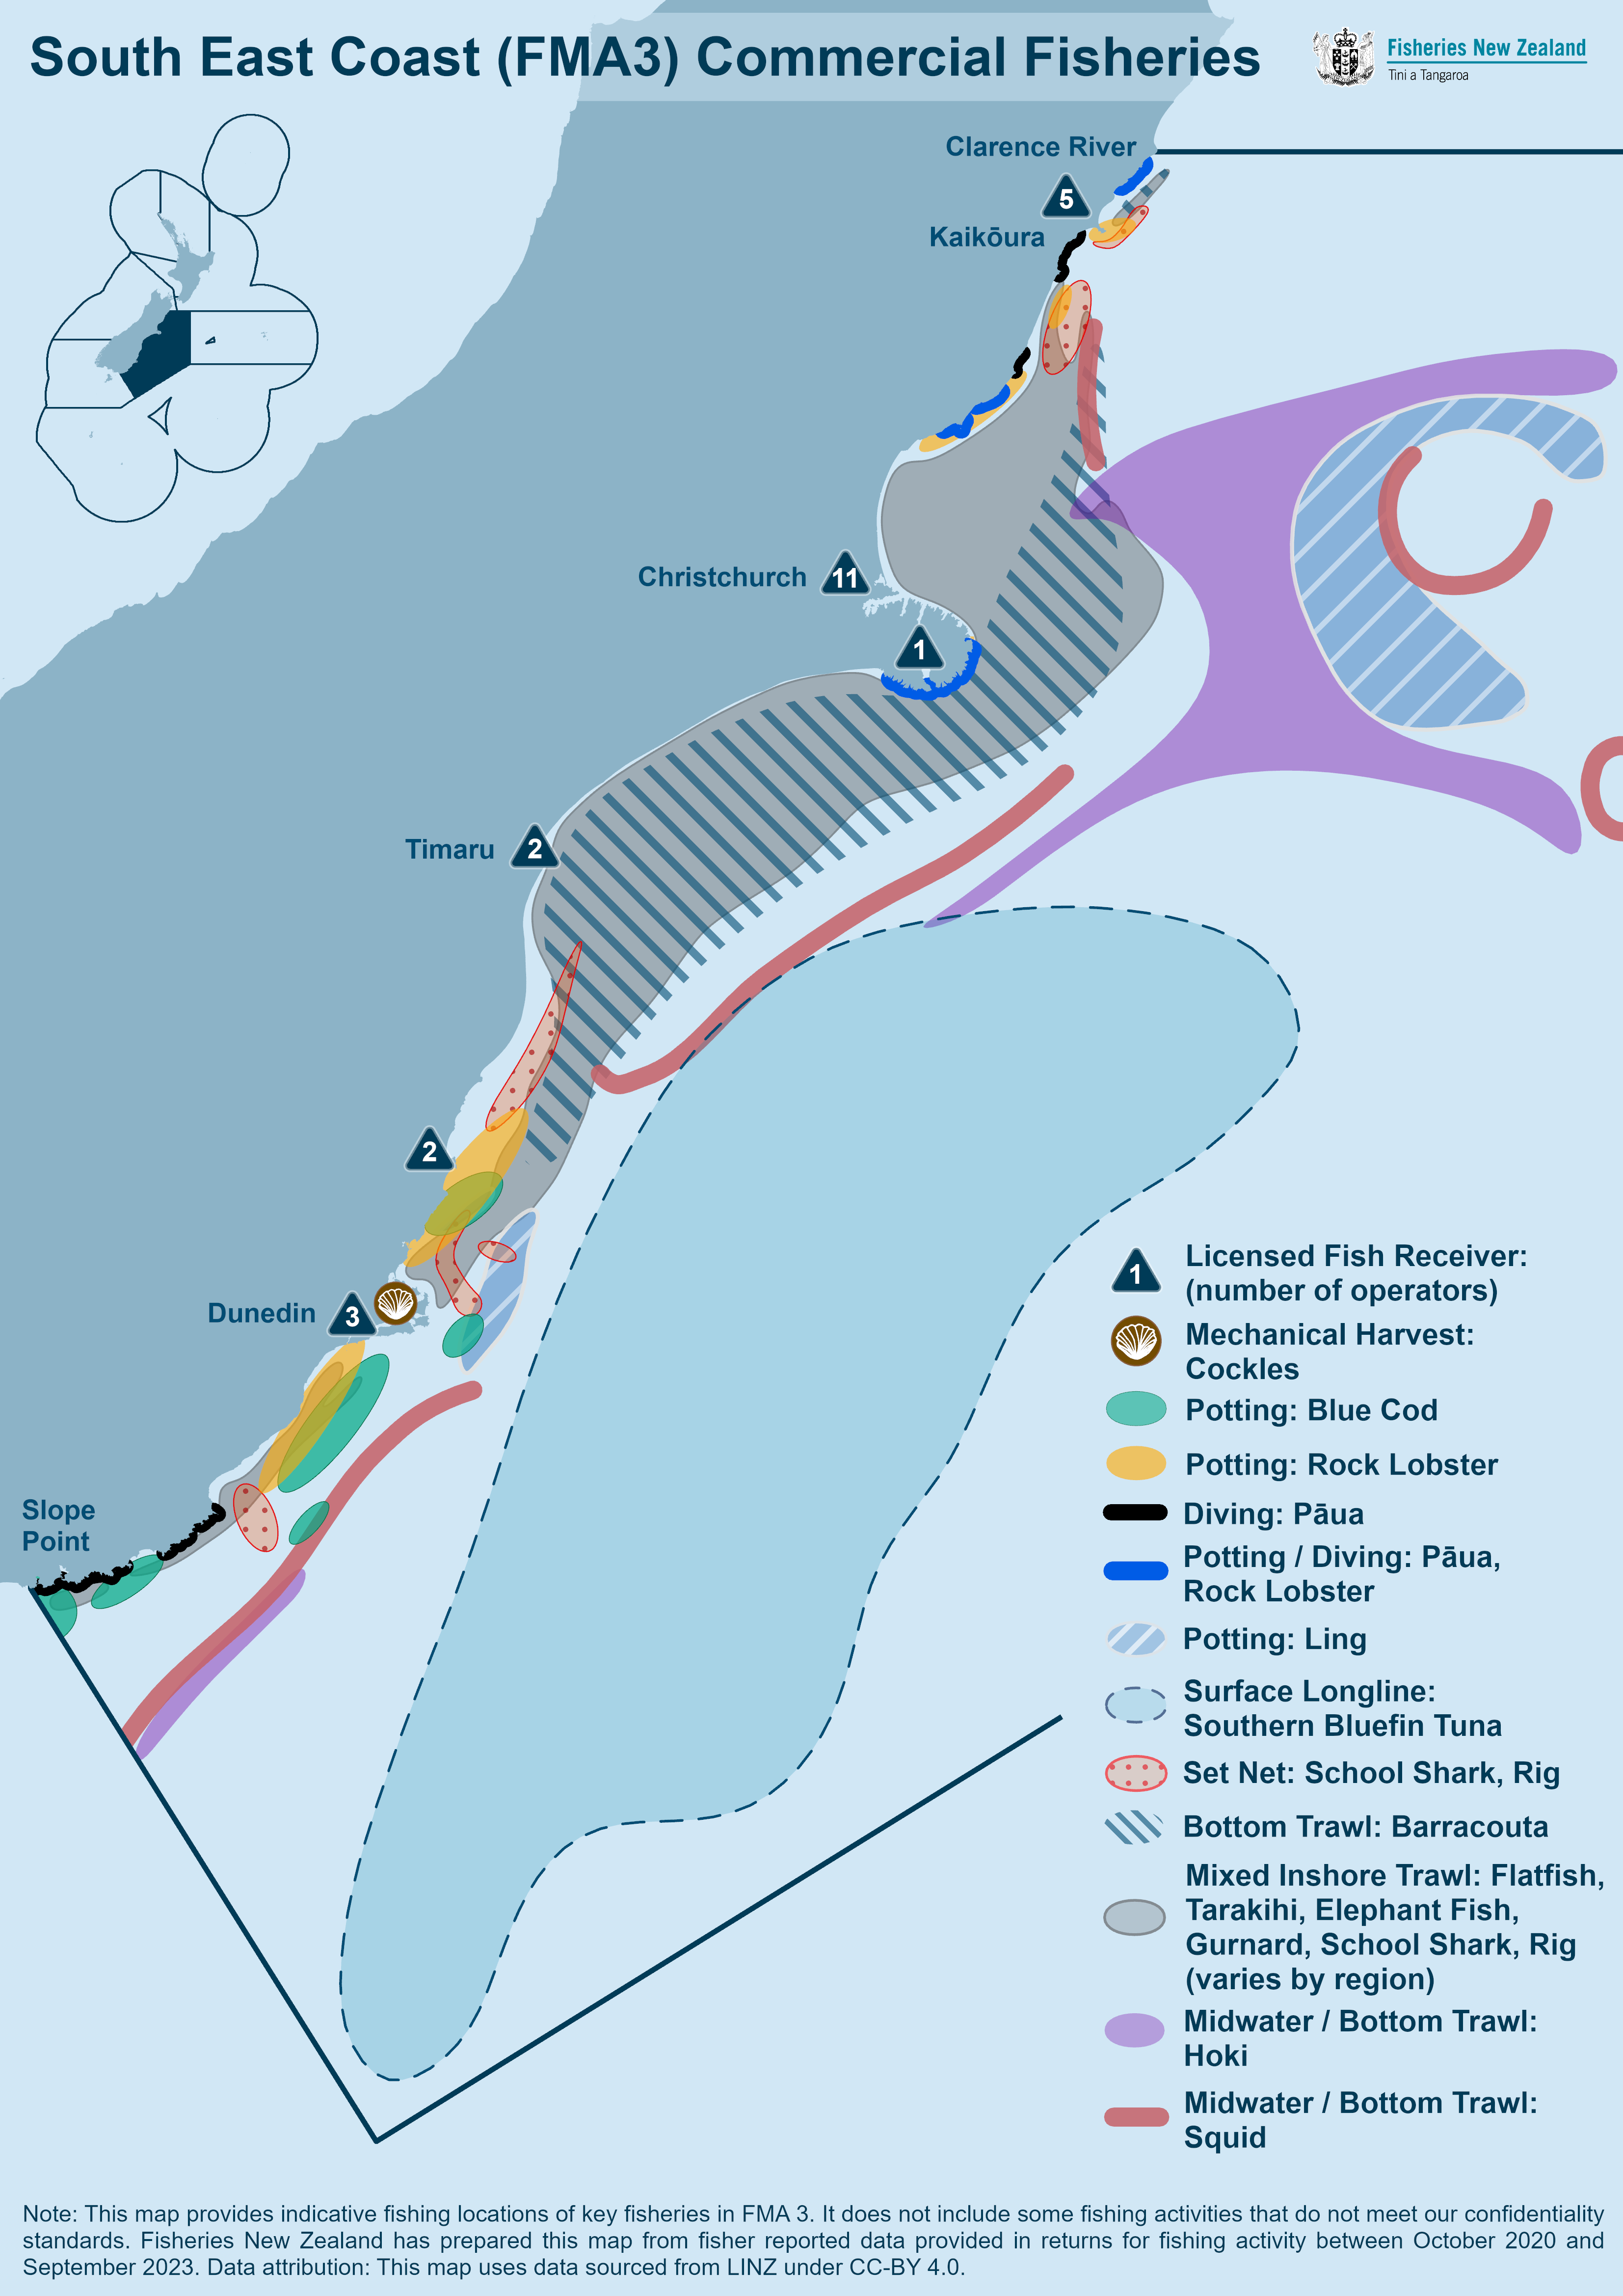 [PNG, 933 KB]
 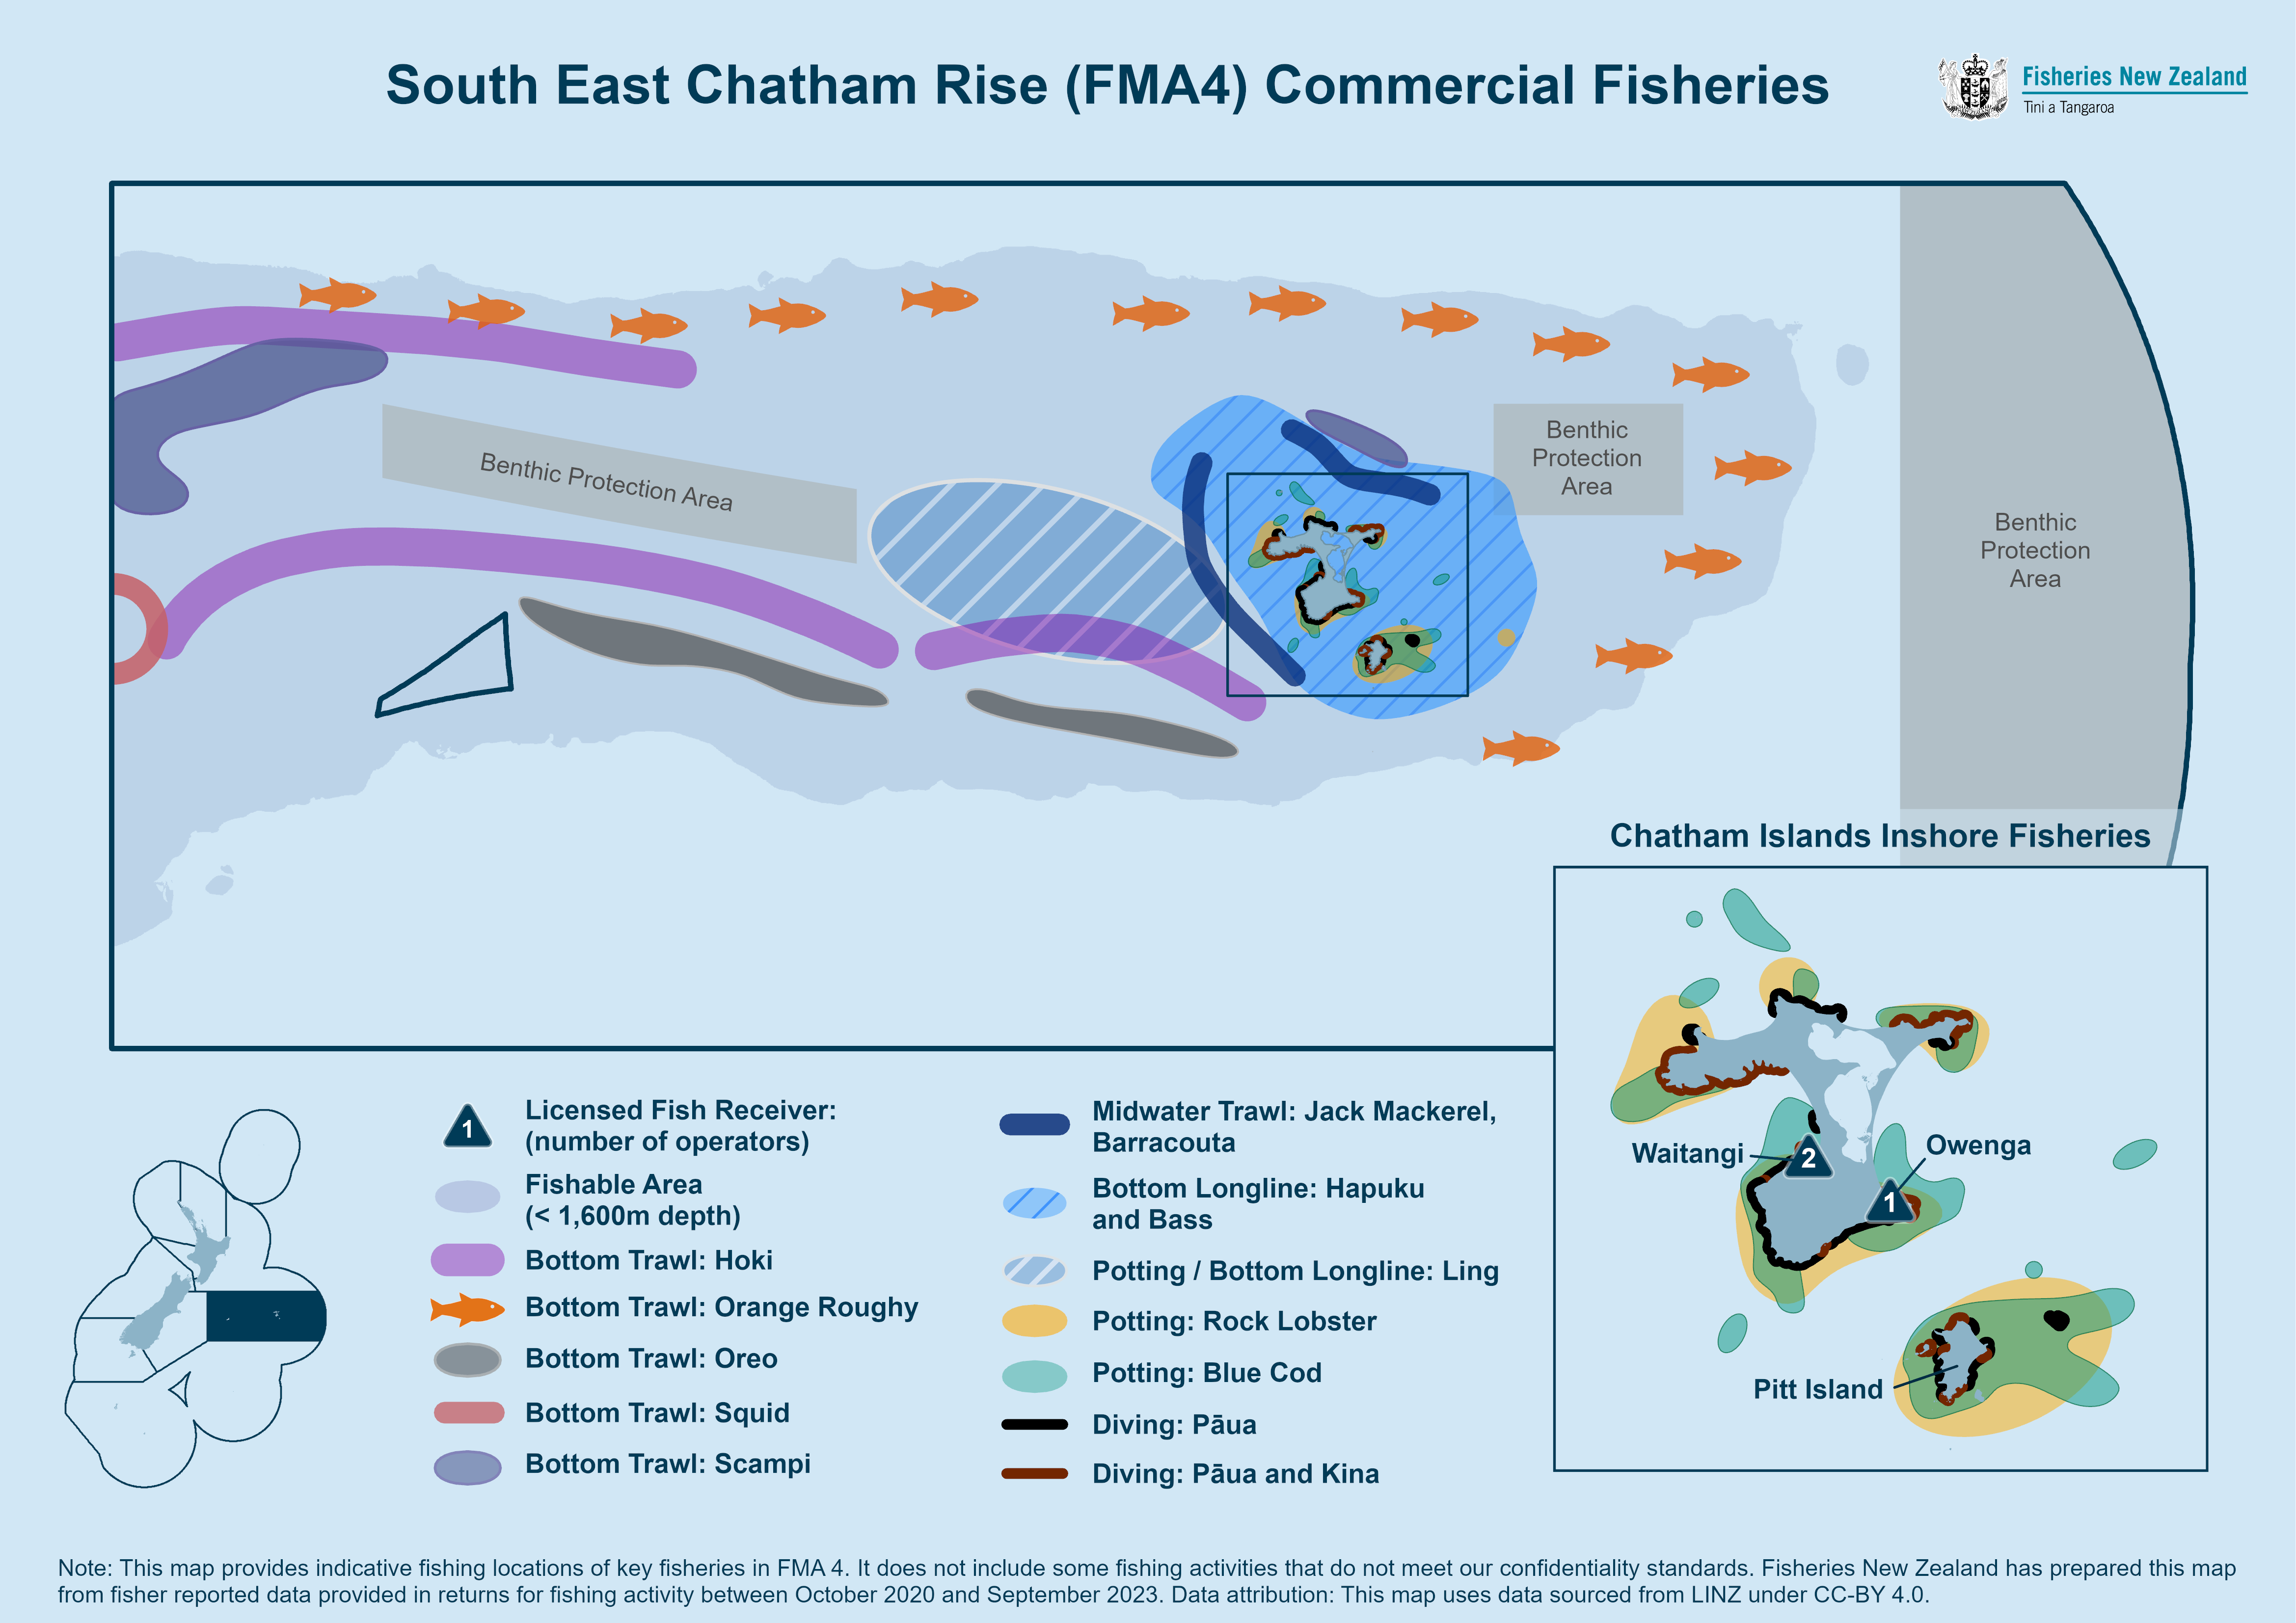 [PNG, 842 KB]
 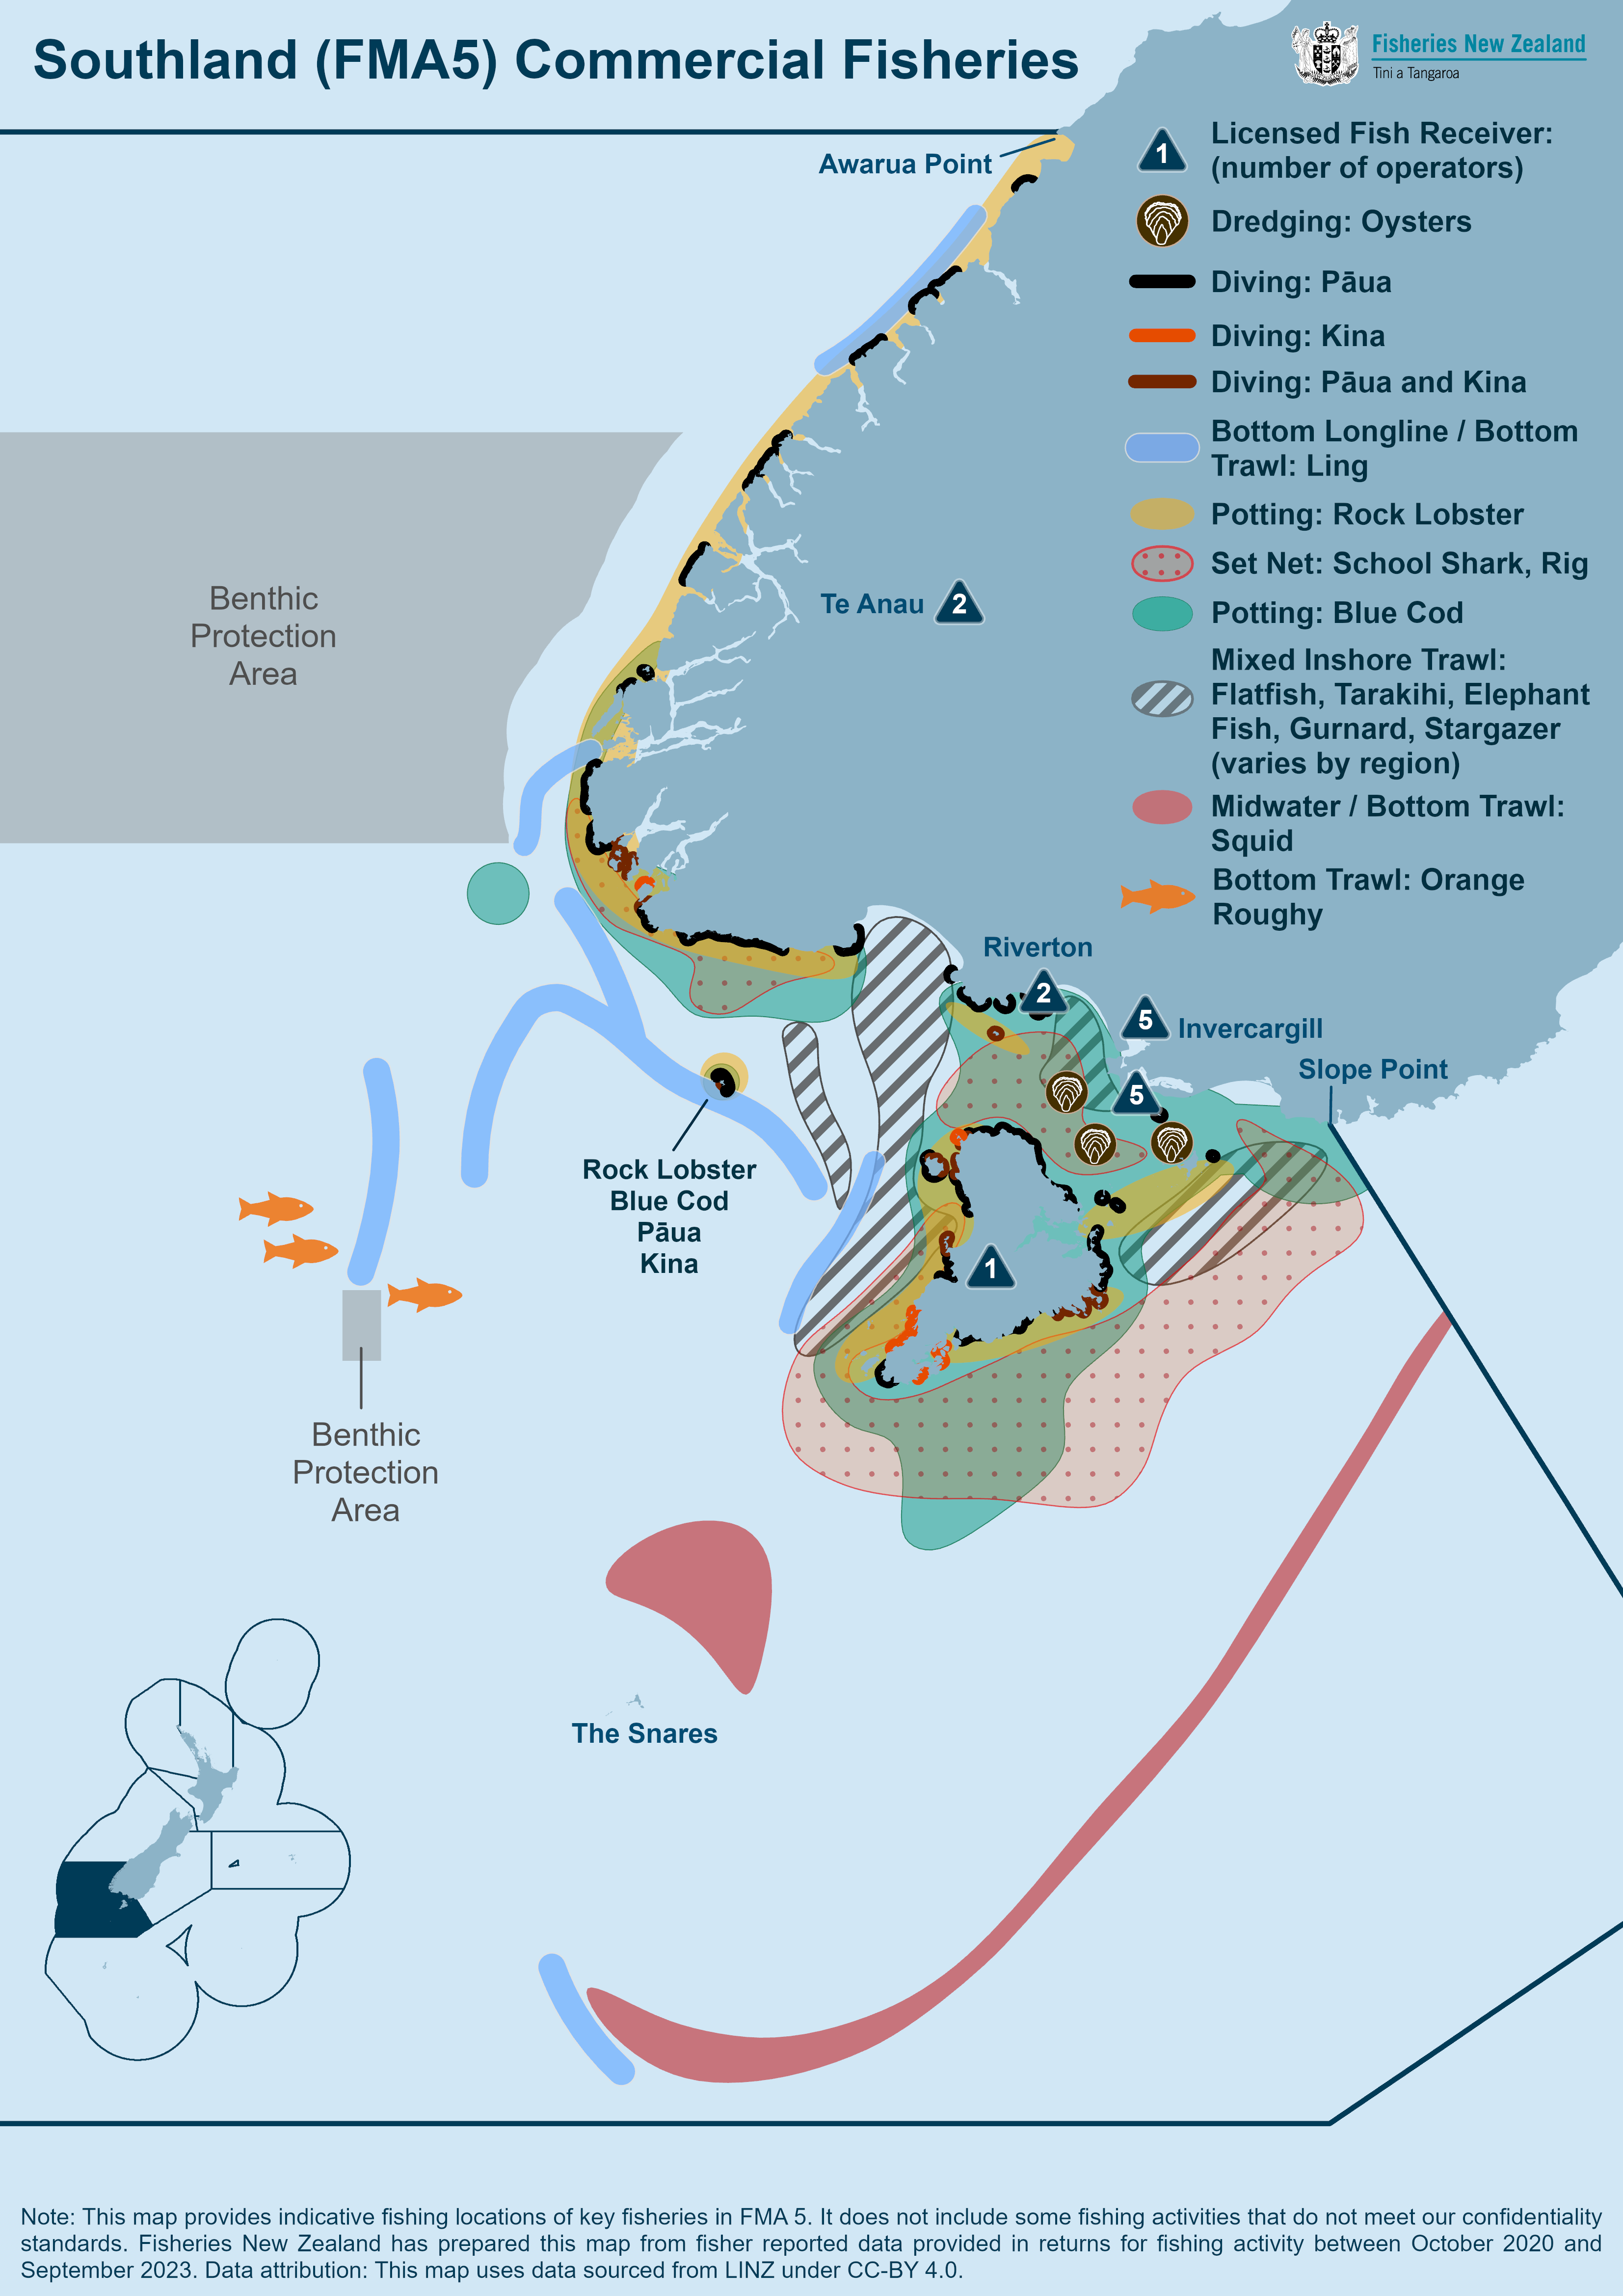 [PNG, 962 KB]
 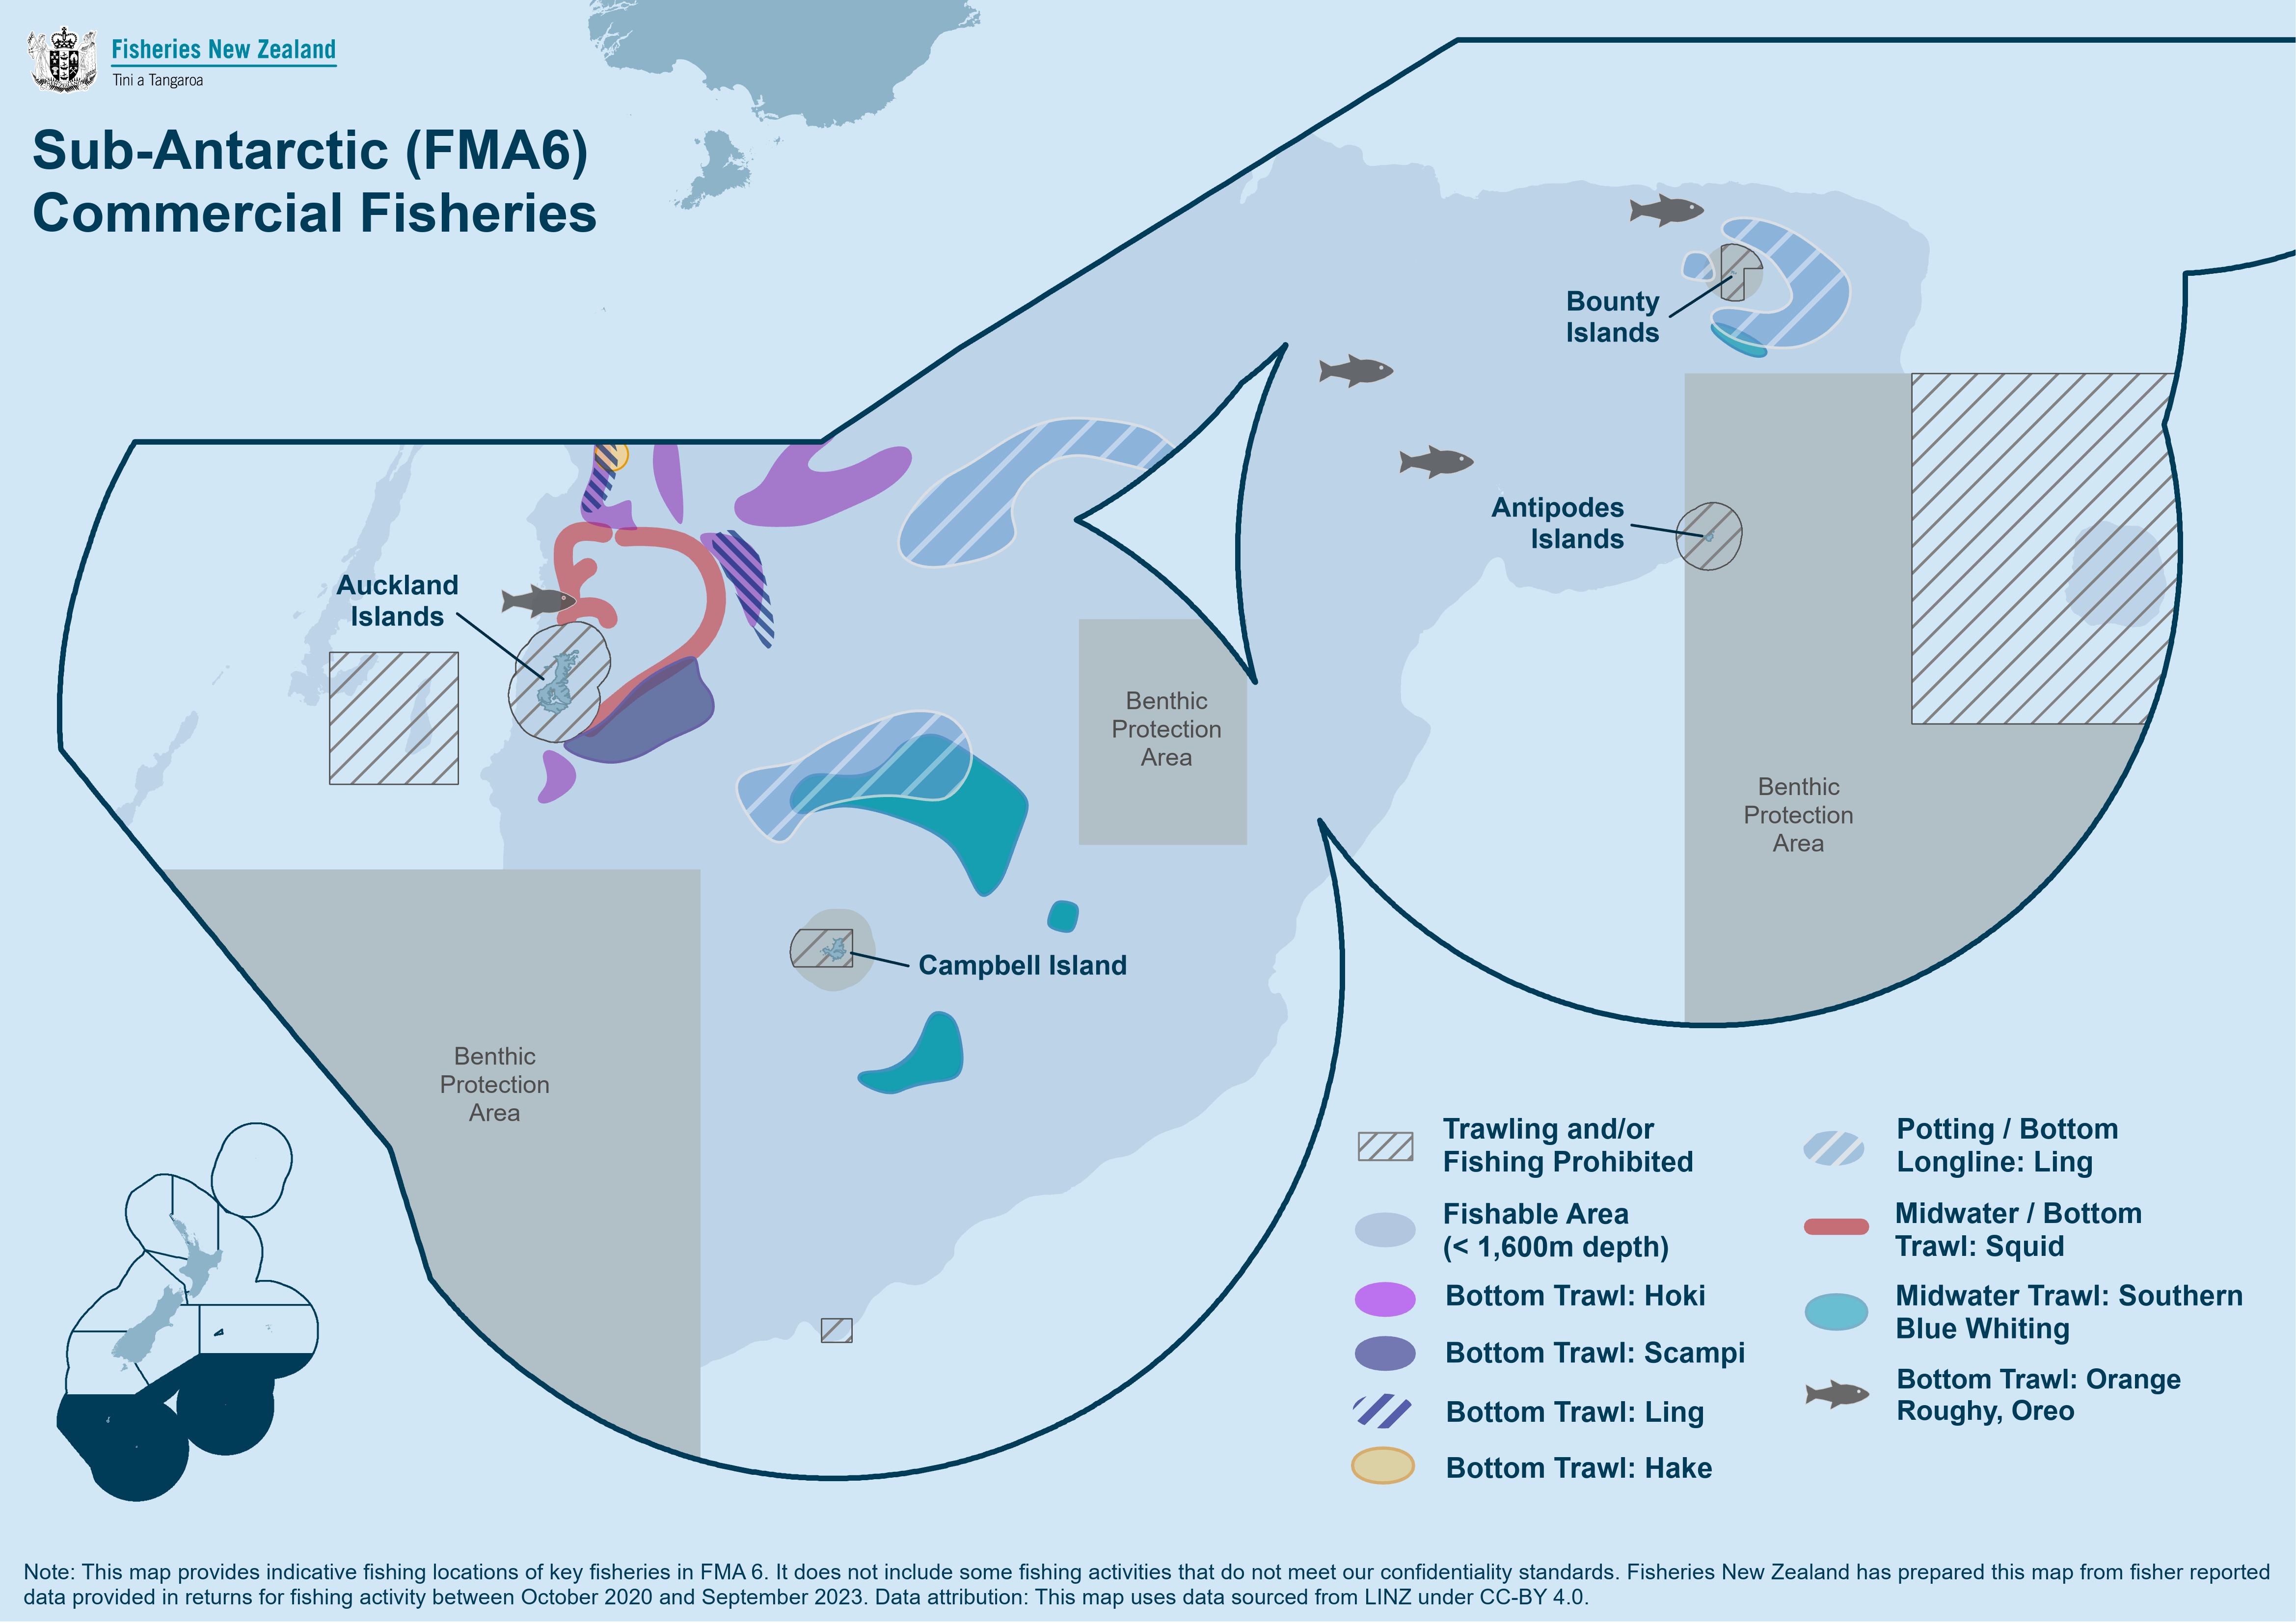 [PNG, 762 KB]
 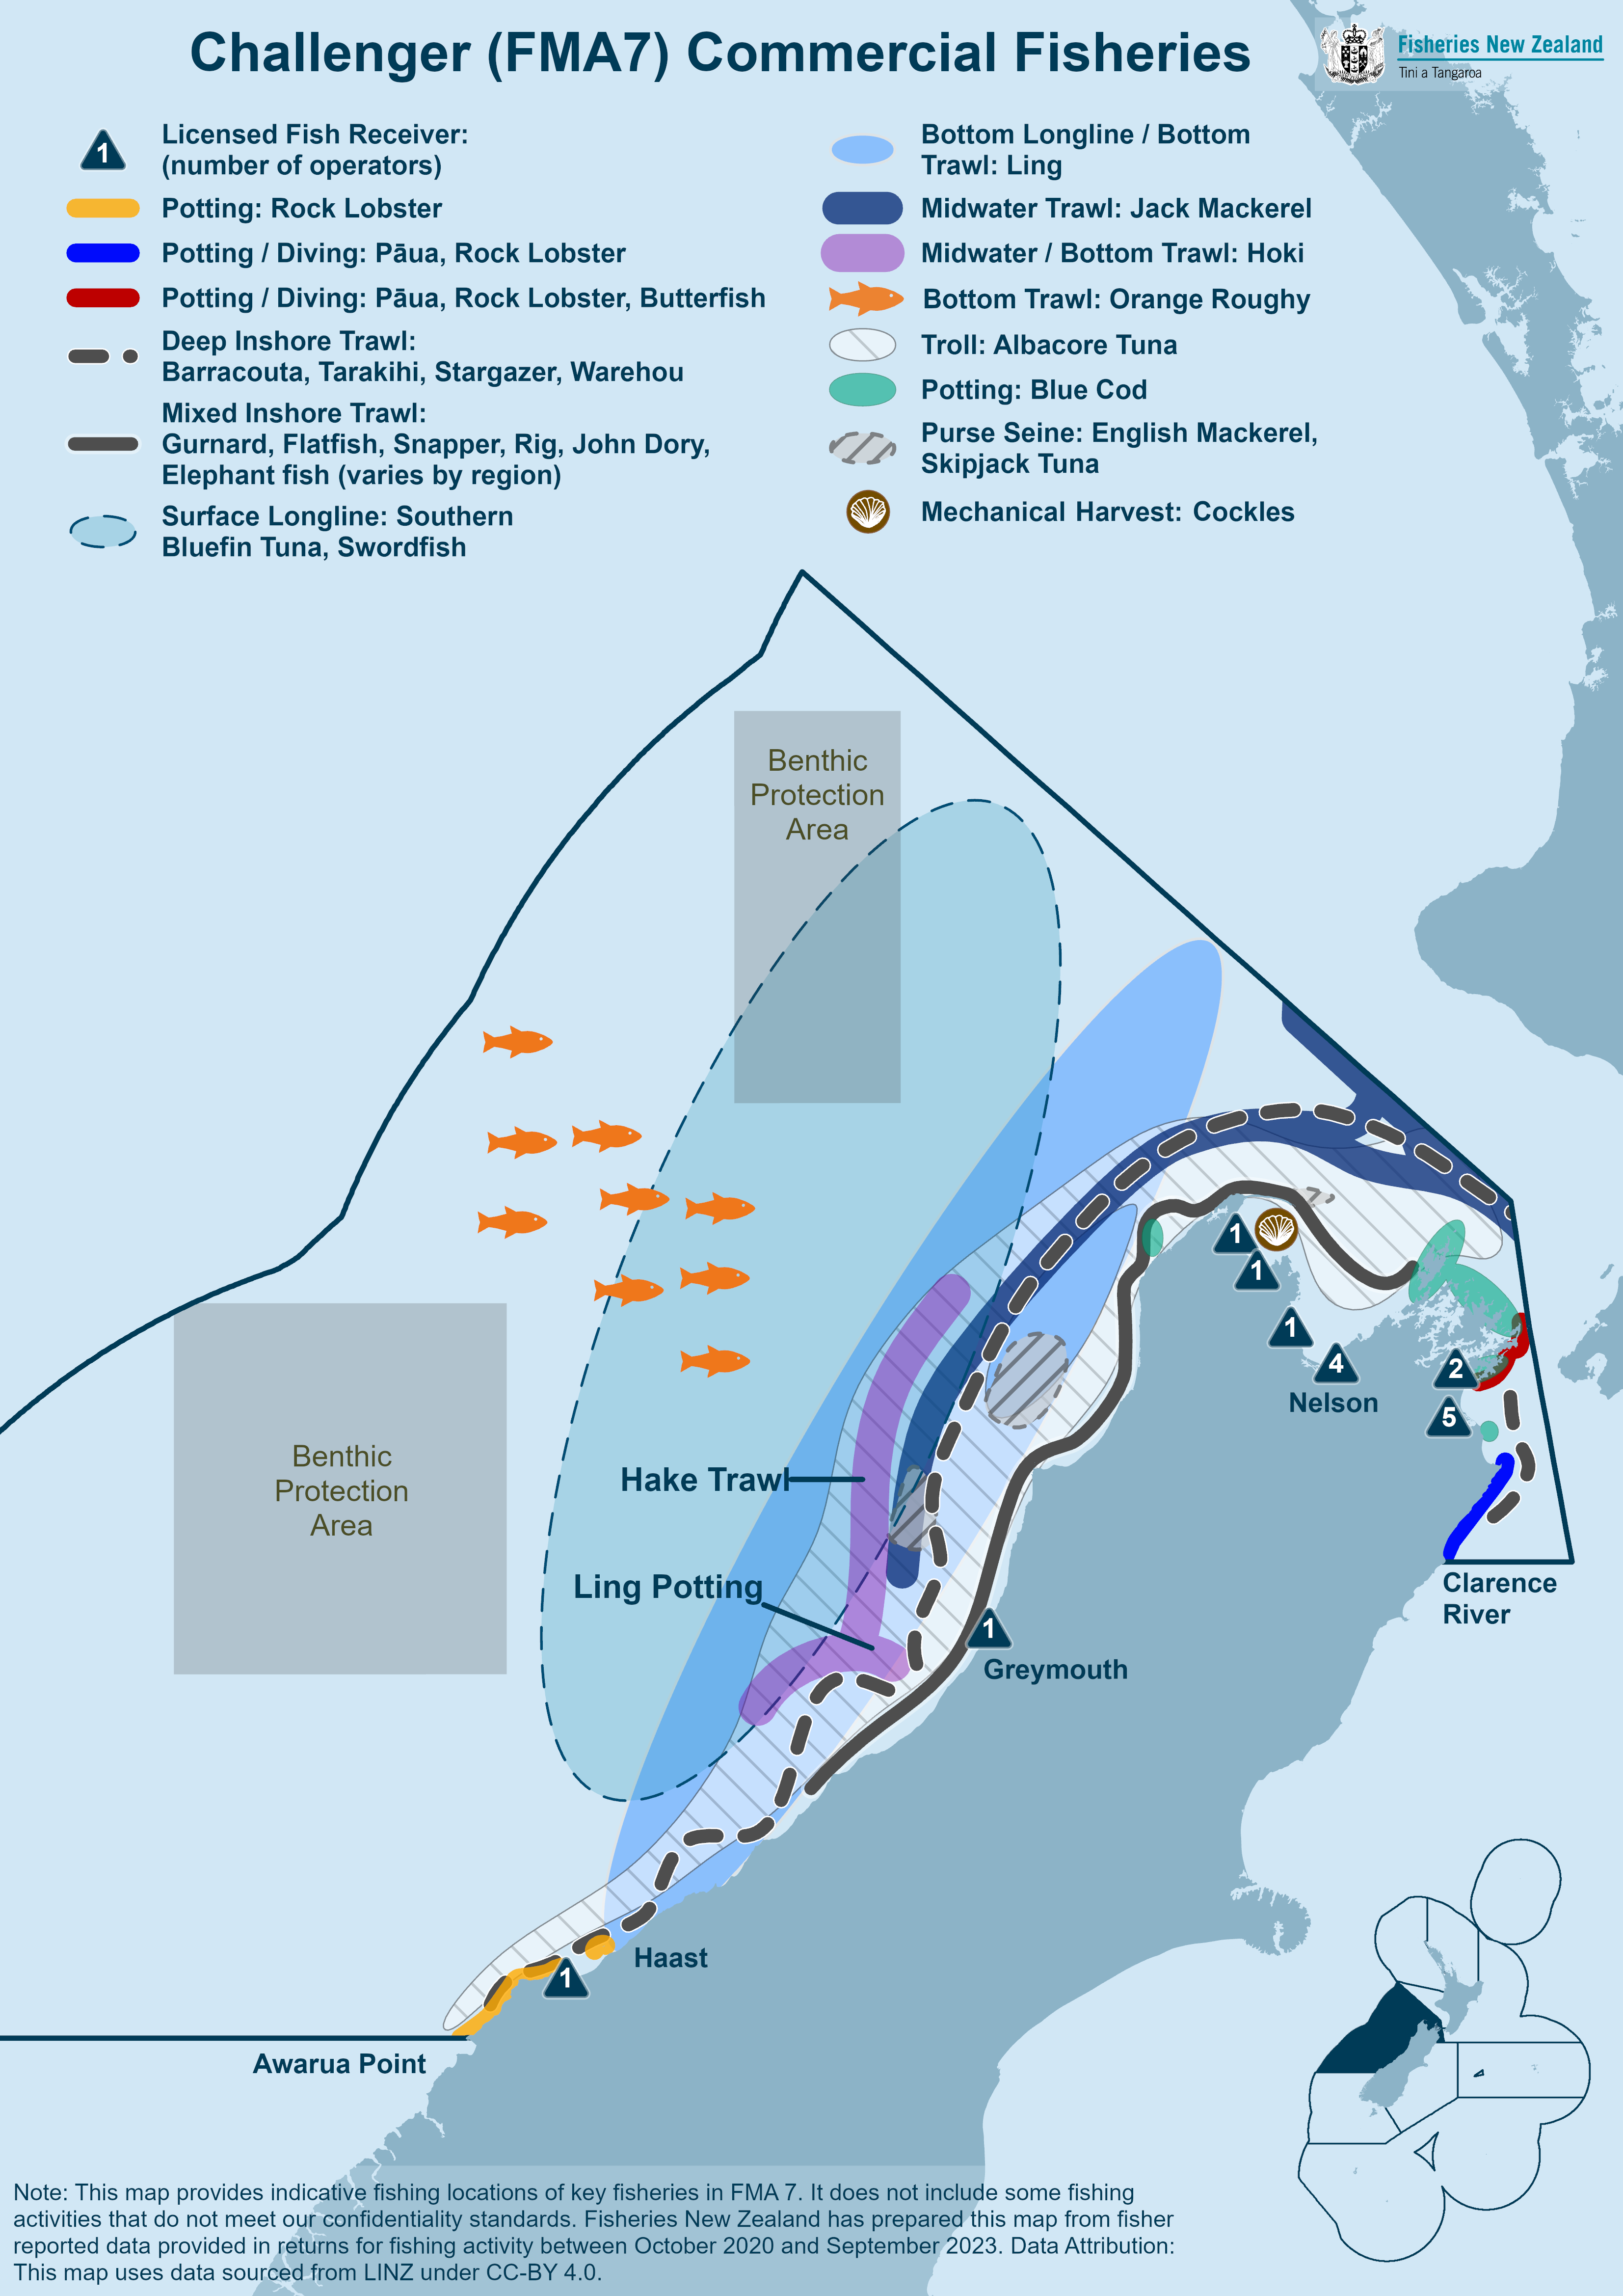 [PNG, 1.1 MB]
 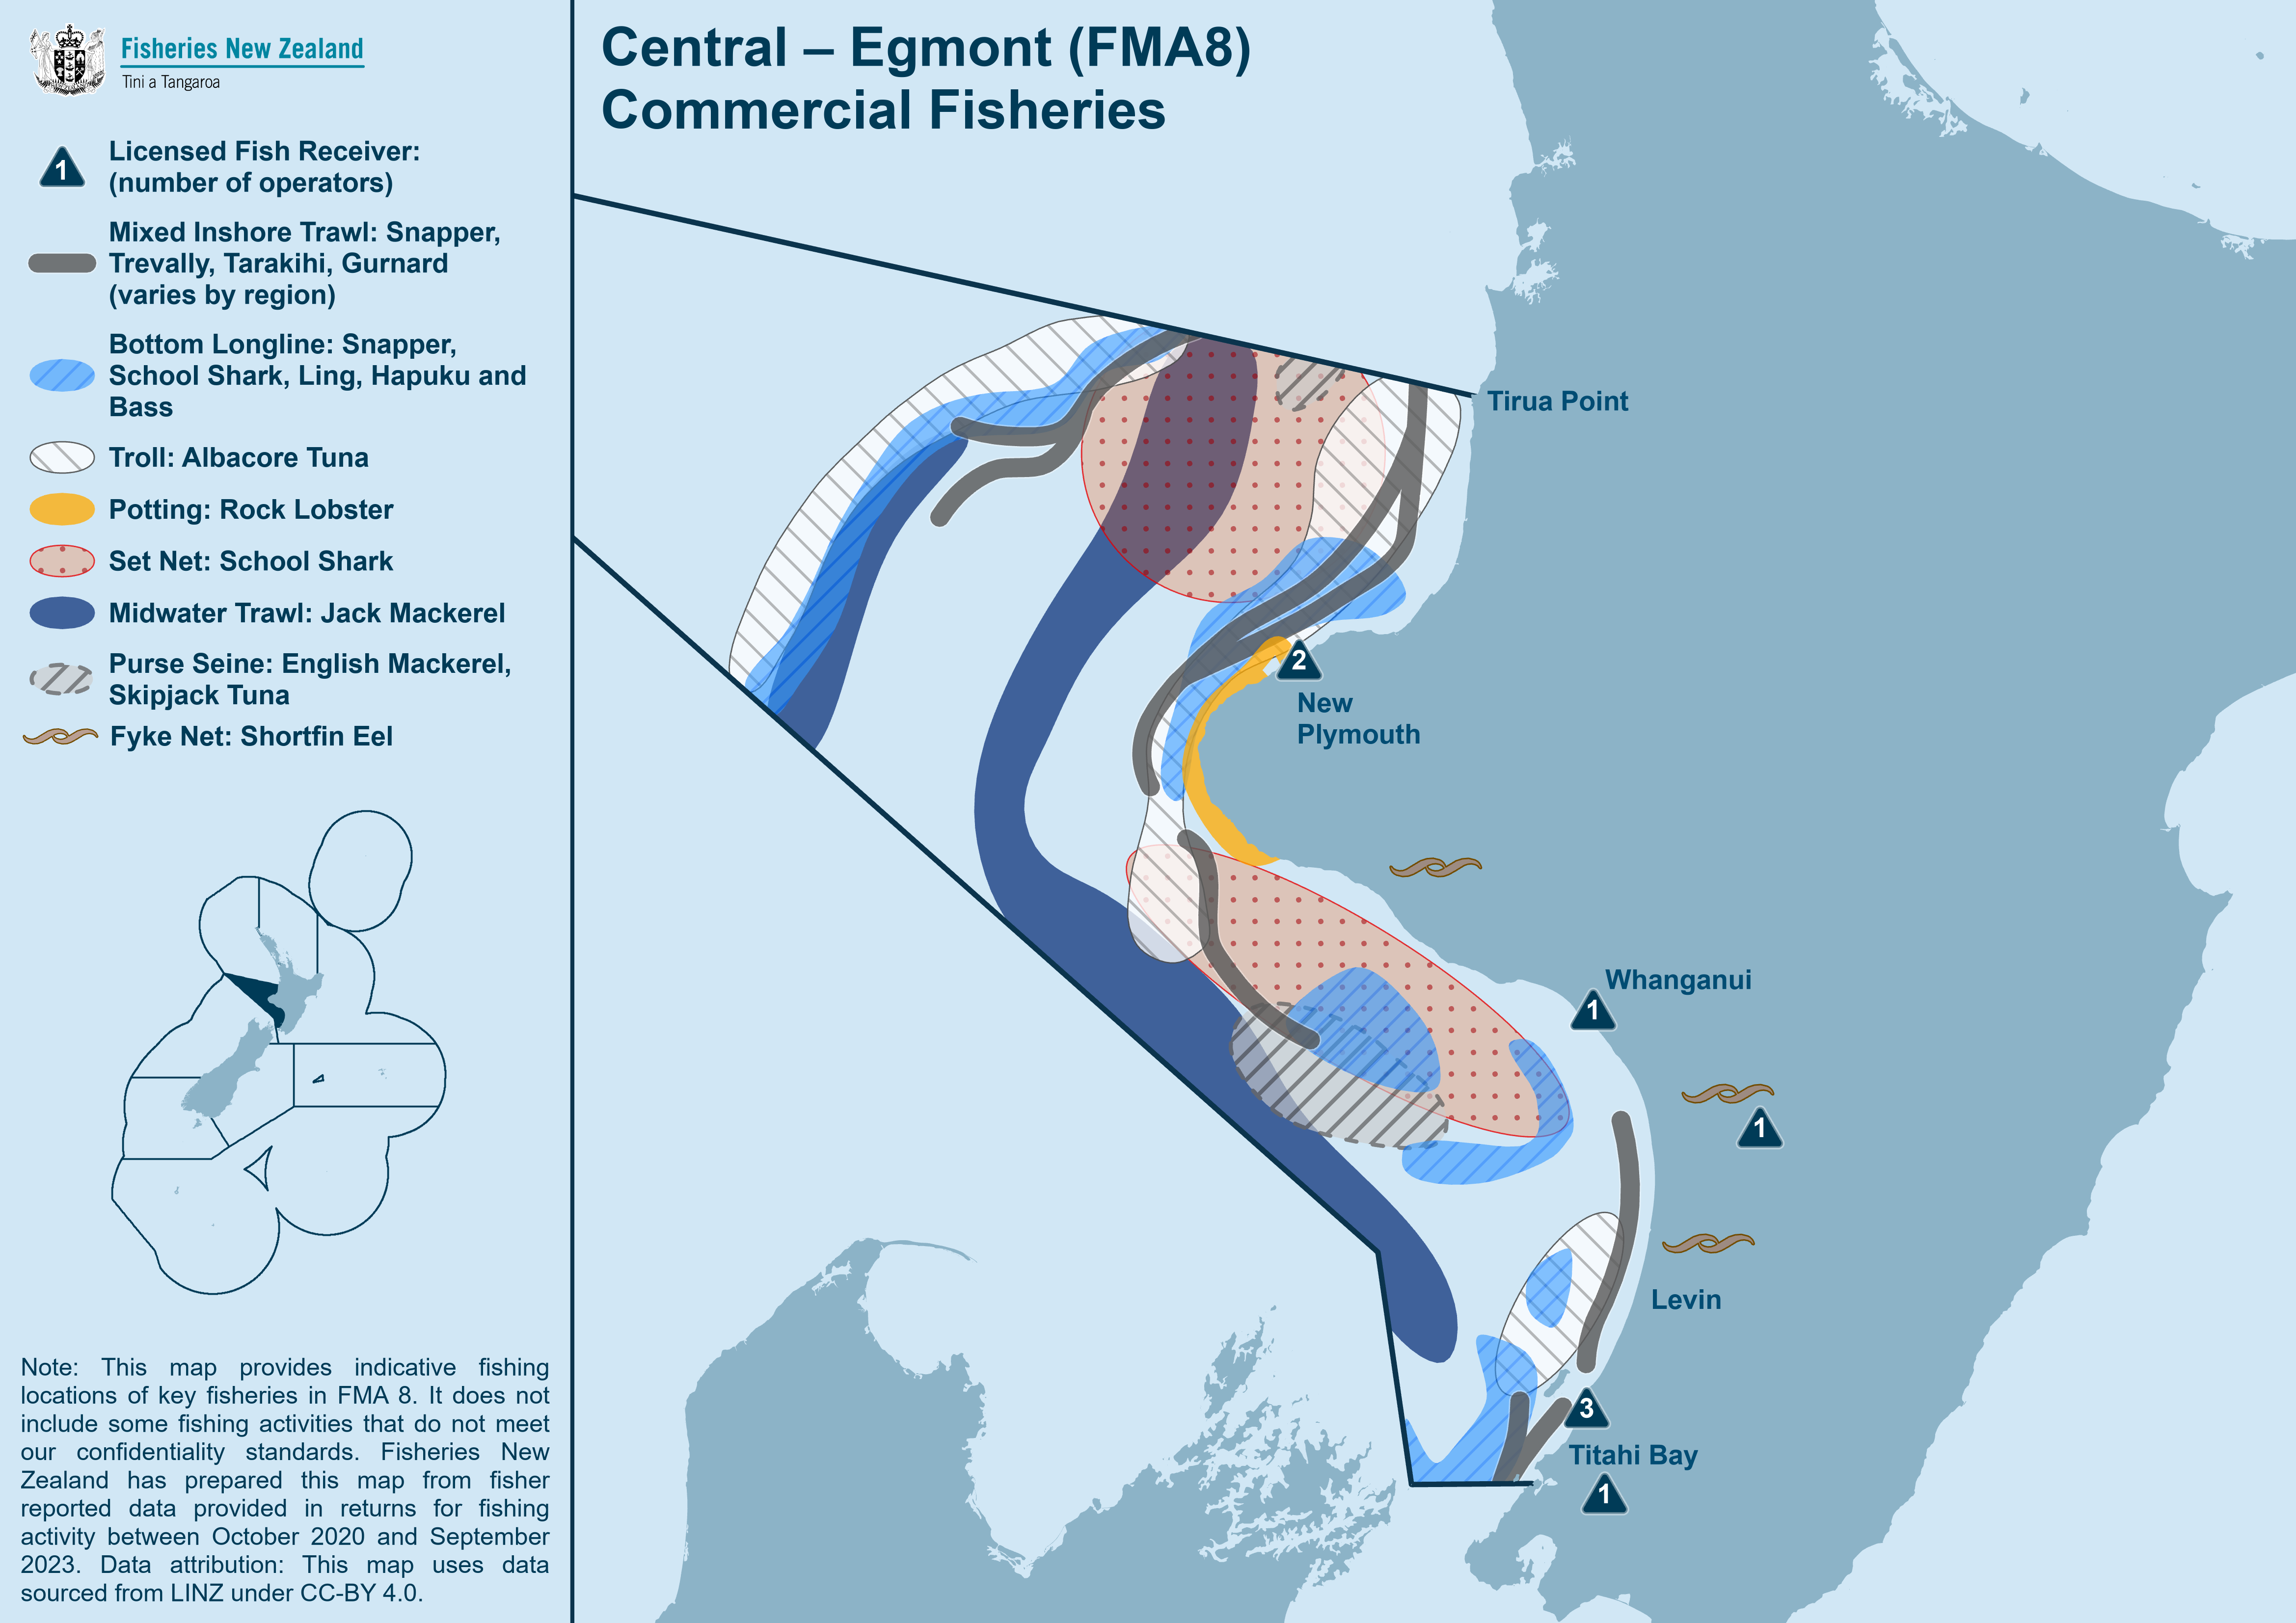 [PNG, 1016 KB]
 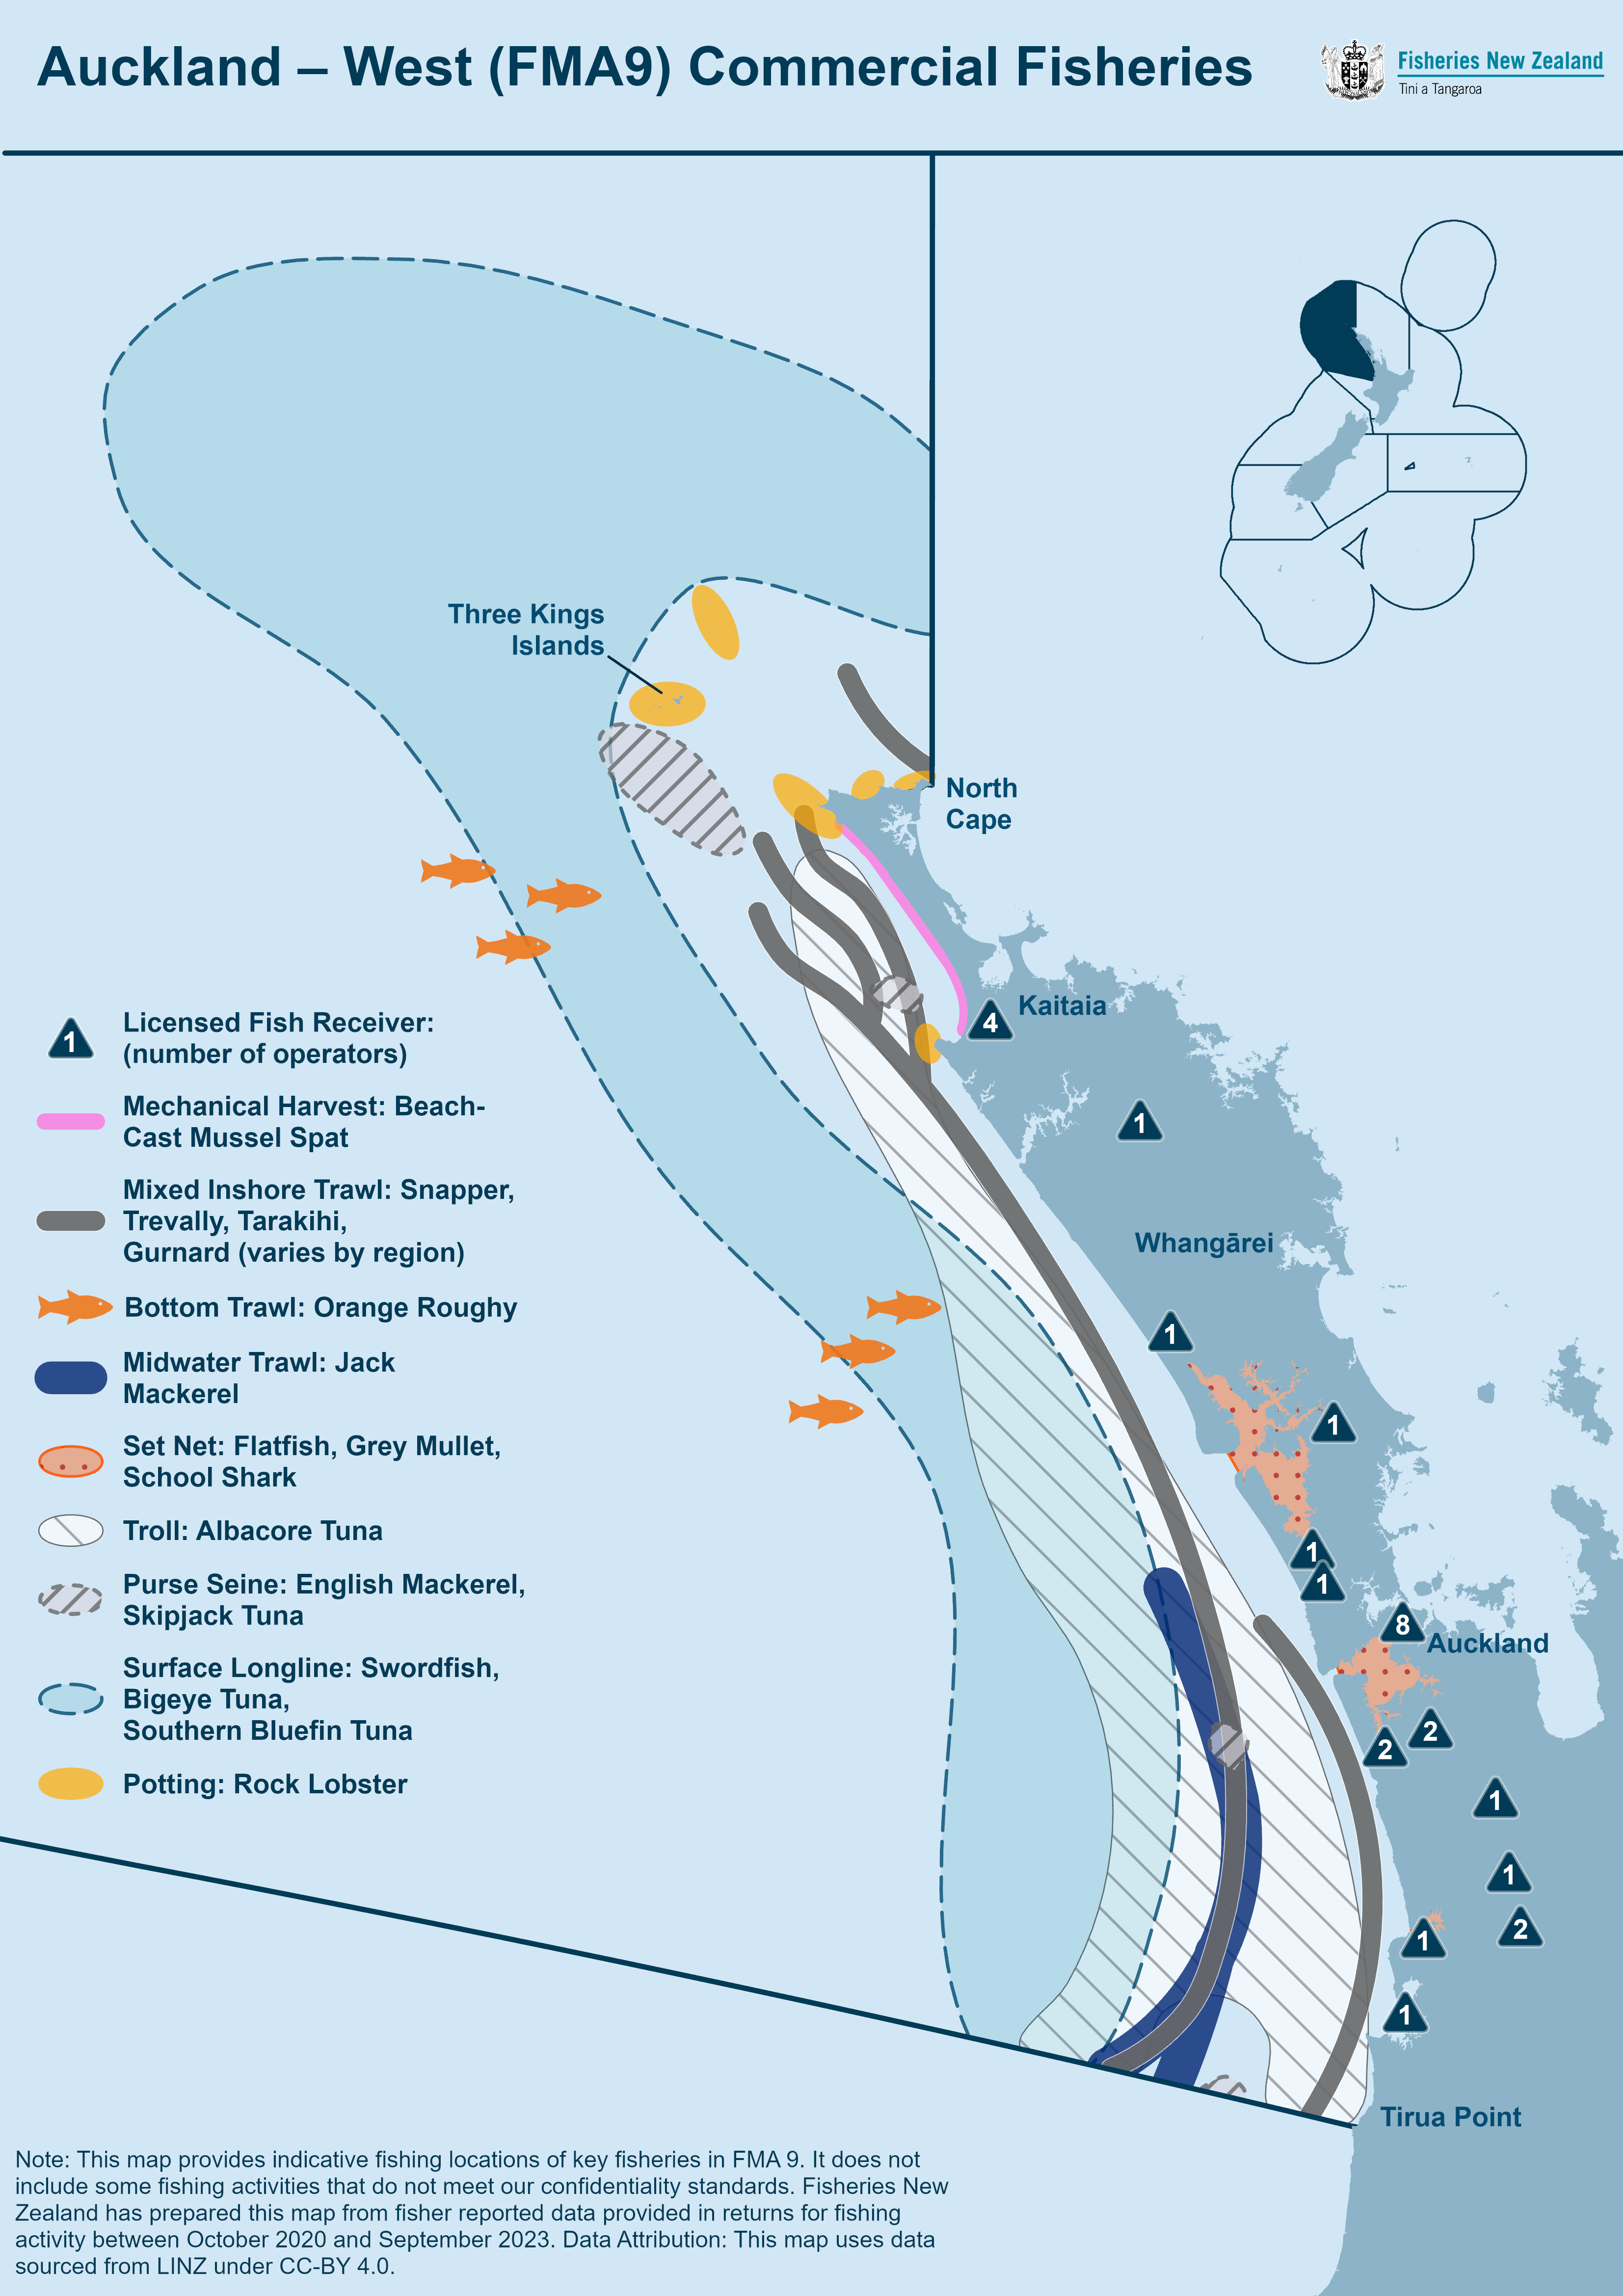 [PNG, 1 MB]
Commercial fishing – all methods

Download a larger, printer-friendly version [PDF, 22 MB]
The distribution of total commercial catch is estimated from all fishing events reported in statutory catch and effort returns for the period 1 October 2007 to 30 September 2025. The location of fishing events is reported by either coordinates or by statistical areas and for the latter, MPI estimates the part of the statistical area used for each type of fishery. Catch by some methods is attributed to the whole statistical area where no better information is available. Since 2019 vessel tracklines have been incorporated into the mapping of fishing events and statistical areas are no longer used. The data is aggregated into grid squares of between 1 and 4,000km² as required to give an 18-year annual average of data from at least 3 permit holders and 3 vessels. Areas containing fewer than 3 permit holders and 3 vessels using similar fishing methods have been omitted from this map.
Commercial fishing – trawl

Download a larger, printer-friendly version [PDF, 21 MB]
The distribution of total commercial trawl catch is estimated from all trawl fishing events reported in statutory catch and effort returns for the period 1 October 2007 to 30 September 2025. The location of fishing events is mapped as the reported tow start and end coordinates, or where necessary, we estimate the trawl direction from the tow start coordinates. Vessel tracklines (when available from 2019 onwards) were used to plot the net path between the start and end points. The data is aggregated into grid squares of between 1 and 4,000km² as required to give an 18-year annual average of data from at least 3 permit holders and 3 vessels. Areas containing fewer than 3 permit holders and 3 vessels have been omitted from this map.
Customary fisheries management areas
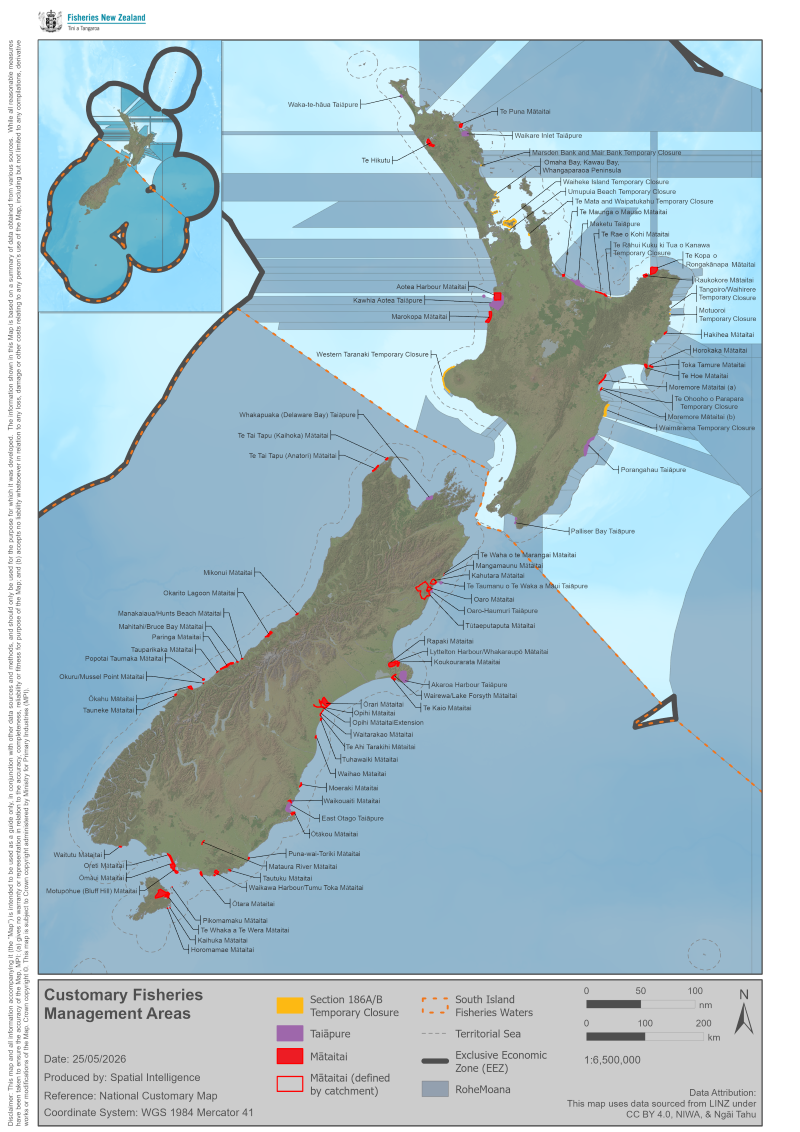
Download a larger, printer-friendly version [PDF, 706 KB]
Recreational fishing (amateur and charter fishing vessels)

Download a larger, printer-friendly version [PDF, 776 KB]
The distribution of recreational fishing is indicated by combining data from flights and boat ramp surveys from 2005 to 2012, and statutory catch and activity returns from charter vessels from 2011 to 2014. The data from the activity returns is aggregated into grid squares of between 4km² and 1,000km² as required to give 4-year annual average of data from at least 3 skippers. Data that could not be aggregated in this way was excluded. Aerial surveys have only happened in some regions, so the relative intensity of fishing between different regions is not accurately portrayed. The areas fished are indicative only. Credits: Hypsometric relief supplied by Geographx. All Rights Reserved, © GeographX 2008. Coastline data sourced from LINZ. Bathymetric data sourced from NIWA.
Marine protected areas

Download a larger, printer-friendly version [PDF, 9.7 MB]
Fishing restrictions are current as of 12/02/2024. Credits: Hypsometric relief supplied by Geographx. All Rights Reserved, © GeographX 2008. Coastline data sourced from LINZ. Bathymetric data sourced from NIWA. Marine Reserve data sourced from DOC.
Who to contact
If you have questions about New Zealand fishery maps, email info@mpi.govt.nz