Quarterly data
Each quarter, the Ministry for Primary Industries (MPI) surveys wood processors from around New Zealand. MPI asks for production statistics on:
- log and roundwood removal
- sawn timber
- panels
- pulp, paper, and paperboard.
MPI asks for stock information on:
- sawn timber
- panels
- pulp and paper.
We survey about 100 timber, panel, and pulp mills throughout New Zealand.
This production information is then compiled with export data sourced from Statistics New Zealand. Combining these 2 data sets allows MPI to calculate an estimate for the roundwood removed from New Zealand forests. This estimate for roundwood removals is then released, along with production and stock information.
Annual data
MPI collects annual forestry production data using the same survey process as the quarterly series. Each year we survey about 100 timber, panel, and pulp mills for production information. For roundwood removals, we combine the production data with export data from Statistics New Zealand to produce the annual estimate.
Log and roundwood removals
Annual roundwood removals are an indicator of export and domestic processing levels.
- Roundwood removals, year ended 31 March, 1951 to most recent [XLSX, 26 KB]
- Roundwood removals by wood supply region, 2002 to most recent [XLSX, 18 KB]
- Estimated processing of roundwood by wood supply region, 2002 to most recent [XLSX, 18 KB]
- Share of total roundwood removals by wood supply regions, 2002 to most recent [XLSX, 17 KB]
Sawn timber
Annual production of sawn timber by island and indigenous sawn timber production by species.
- Production of sawn timber, 1970 to most recent [XLSX, 23 KB]
- Indigenous sawn timber by species [XLSX, 11 KB]
Panels
Pulp, paper, and paperboard
- Production of pulp, 1951 to most recent [XLSX, 18 KB]
- Production of paper and paperboard, 1951 to most recent [XLSX, 16 KB]
Mass timber production survey
Te Uru Rākau – New Zealand Forest Service created the mass timber production survey in 2023. The survey's purpose is to understand the production volumes of engineered timber greater than 360 mm x 90 mm, including:
- cross-laminated timber (CLT)
- laminated veneer lumber (LVL)
- glue laminated timber (glulam).
Each year we collect data from wood processors identified as potential producers of mass timber products.
Results from the 2025 mass timber survey.
- The results show New Zealand’s mass timber industry has grown strongly over recent years. Production peaked in 2022. There has been a contraction since then, but the medium-term outlook is positive.
- For more context, we’ve included an index based on the number of dwellings consented in figure 1. New dwellings consented refers to the count of building permits approved. This serves as a general indicator of planned construction activity.
- The mass timber production and new dwellings consented indices show similar trends. They rise until 2022, then decline in 2023 and 2024. This shows construction activity plays a big role in mass timber production volumes.
- The mass timber production forecast shows a slight increase in 2025. The survey forecasts a dip for mass timber production in 2026. However, the forecasted production remains higher than in 2023 and 2024.
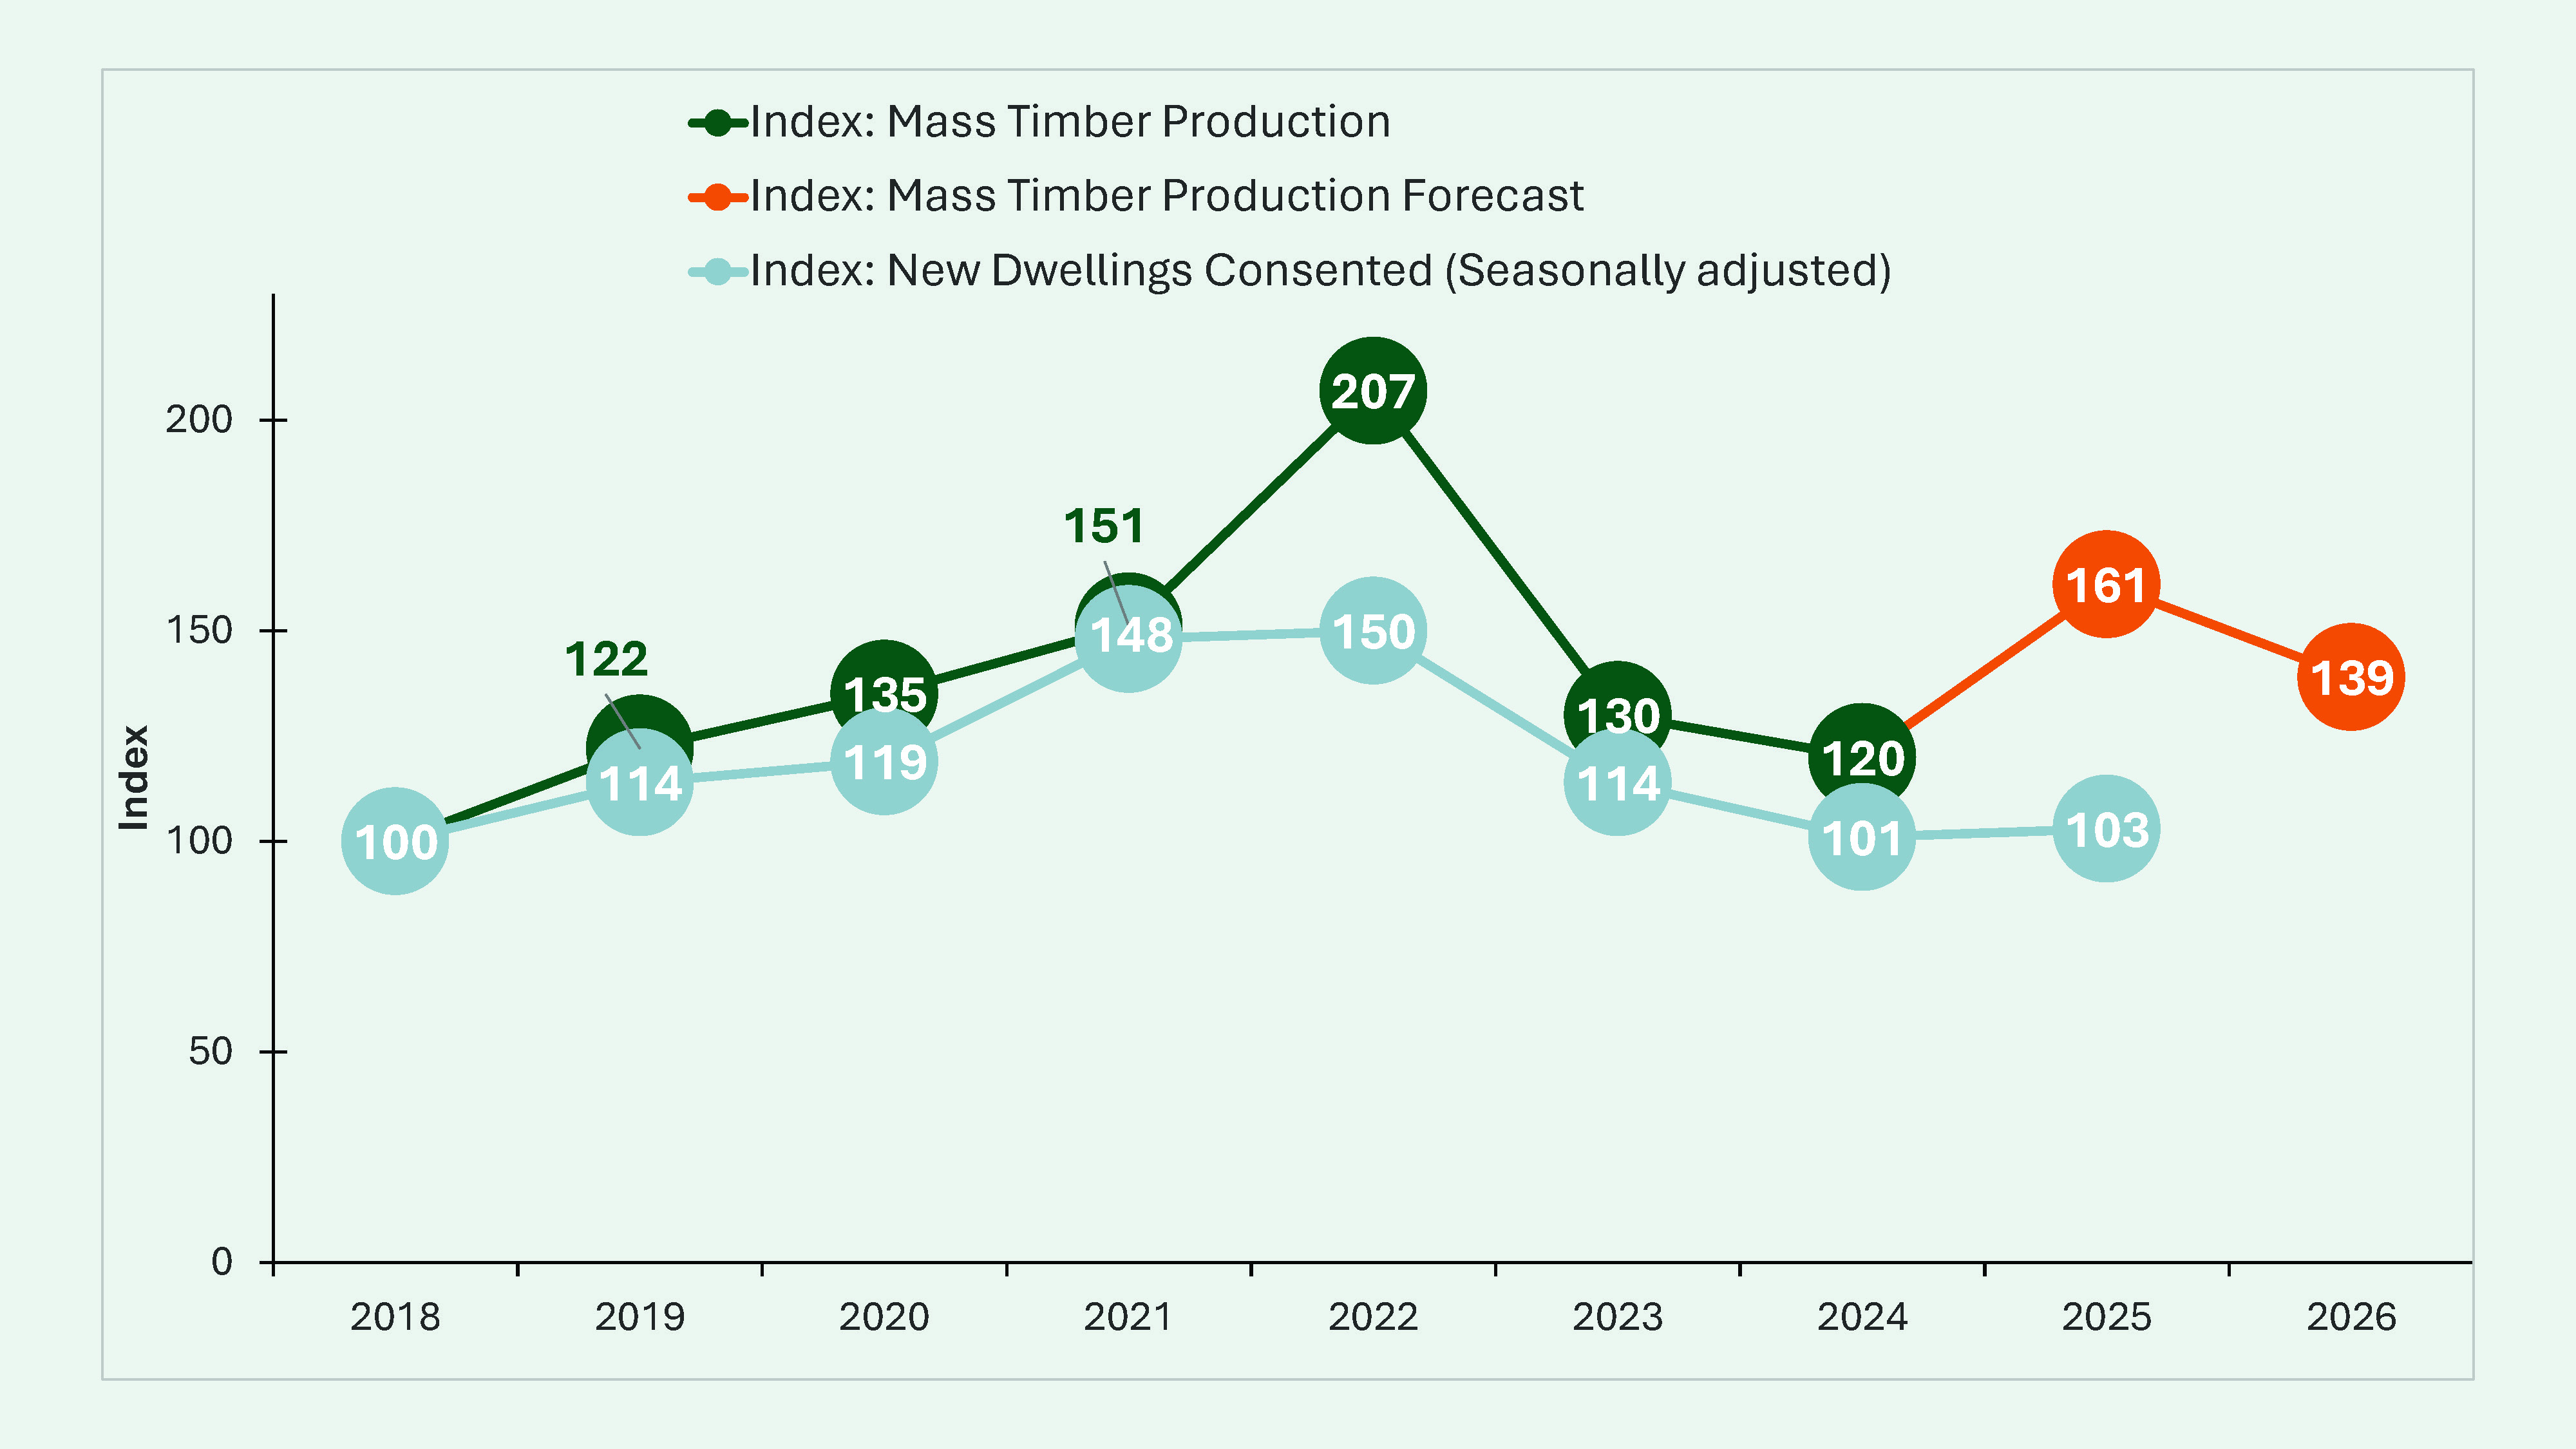
Figure 1: Mass timber production index vs. new dwellings consented (seasonally adjusted)
The figure shows a line chart. There are 3 lines on the chart.
A green line shows the index for mass timber production. On the line, green circles show the index for each year from 2018 to 2024. The line shows the index amounts increasing each year until 2022, then decreasing for 2023 and 2024. The actual index amounts are:
- 100 in 2018
- 122 in 2019
- 135 in 2020
- 151 in 2021
- 207 in 2022
- 130 in 2023
- 120 in 2024.
An orange line shows the index for the mass timber production forecast. It’s joined to the end of the green line and shows orange index circles for the years 2025 and 2026. The line shows a forecasted increase in 2025 and a decrease in 2026. The forecast index amounts are:
- 161 in 2025
- 139 in 2026.
A grey line shows the index for new dwellings consented (seasonally adjusted). On the line, grey circles show the index for each year from 2018 to 2025. The line shows the index amounts increasing each year until 2022. The amounts decrease in 2023 and 2024, then stabilise in 2025. The actual index amounts are:
- 100 in 2018
- 114 in 2019
- 119 in 2020
- 148 in 2021
- 150 in 2022
- 114 in 2023
- 101 in 2024
- 103 in 2025.
About the survey methodology and index
- We carried out this survey in 2025. It’s the second year we did the survey.
- We sent an online survey to 18 wood processors identified as potential producers of mass timber products. We collected data by working with representatives from mass timber producers.
- We collected information on each processor’s total volumes for CLT, LVL, and glulam of product greater than 360 mm x 90 mm.
- We added the data to the values collected from the 2024 survey.
- The 2025 survey received a total of 11 responses. Of these processors, 3 said they are not currently producing mass timber products. Due to commercial sensitivity, we have presented the total volume for all products as an index rather than actual volume figures.
- The index uses data from 2018 as a baseline, transforming the volume measured in that year to a baseline value of 100. The volumes of later years are then compared to the data from 2018. If the total is greater, the index value is above 100; if it is lower, the value is below 100. For example, in 2022, the index has a value of 207, which means that the volume for that year was 107% higher than that of 2018.